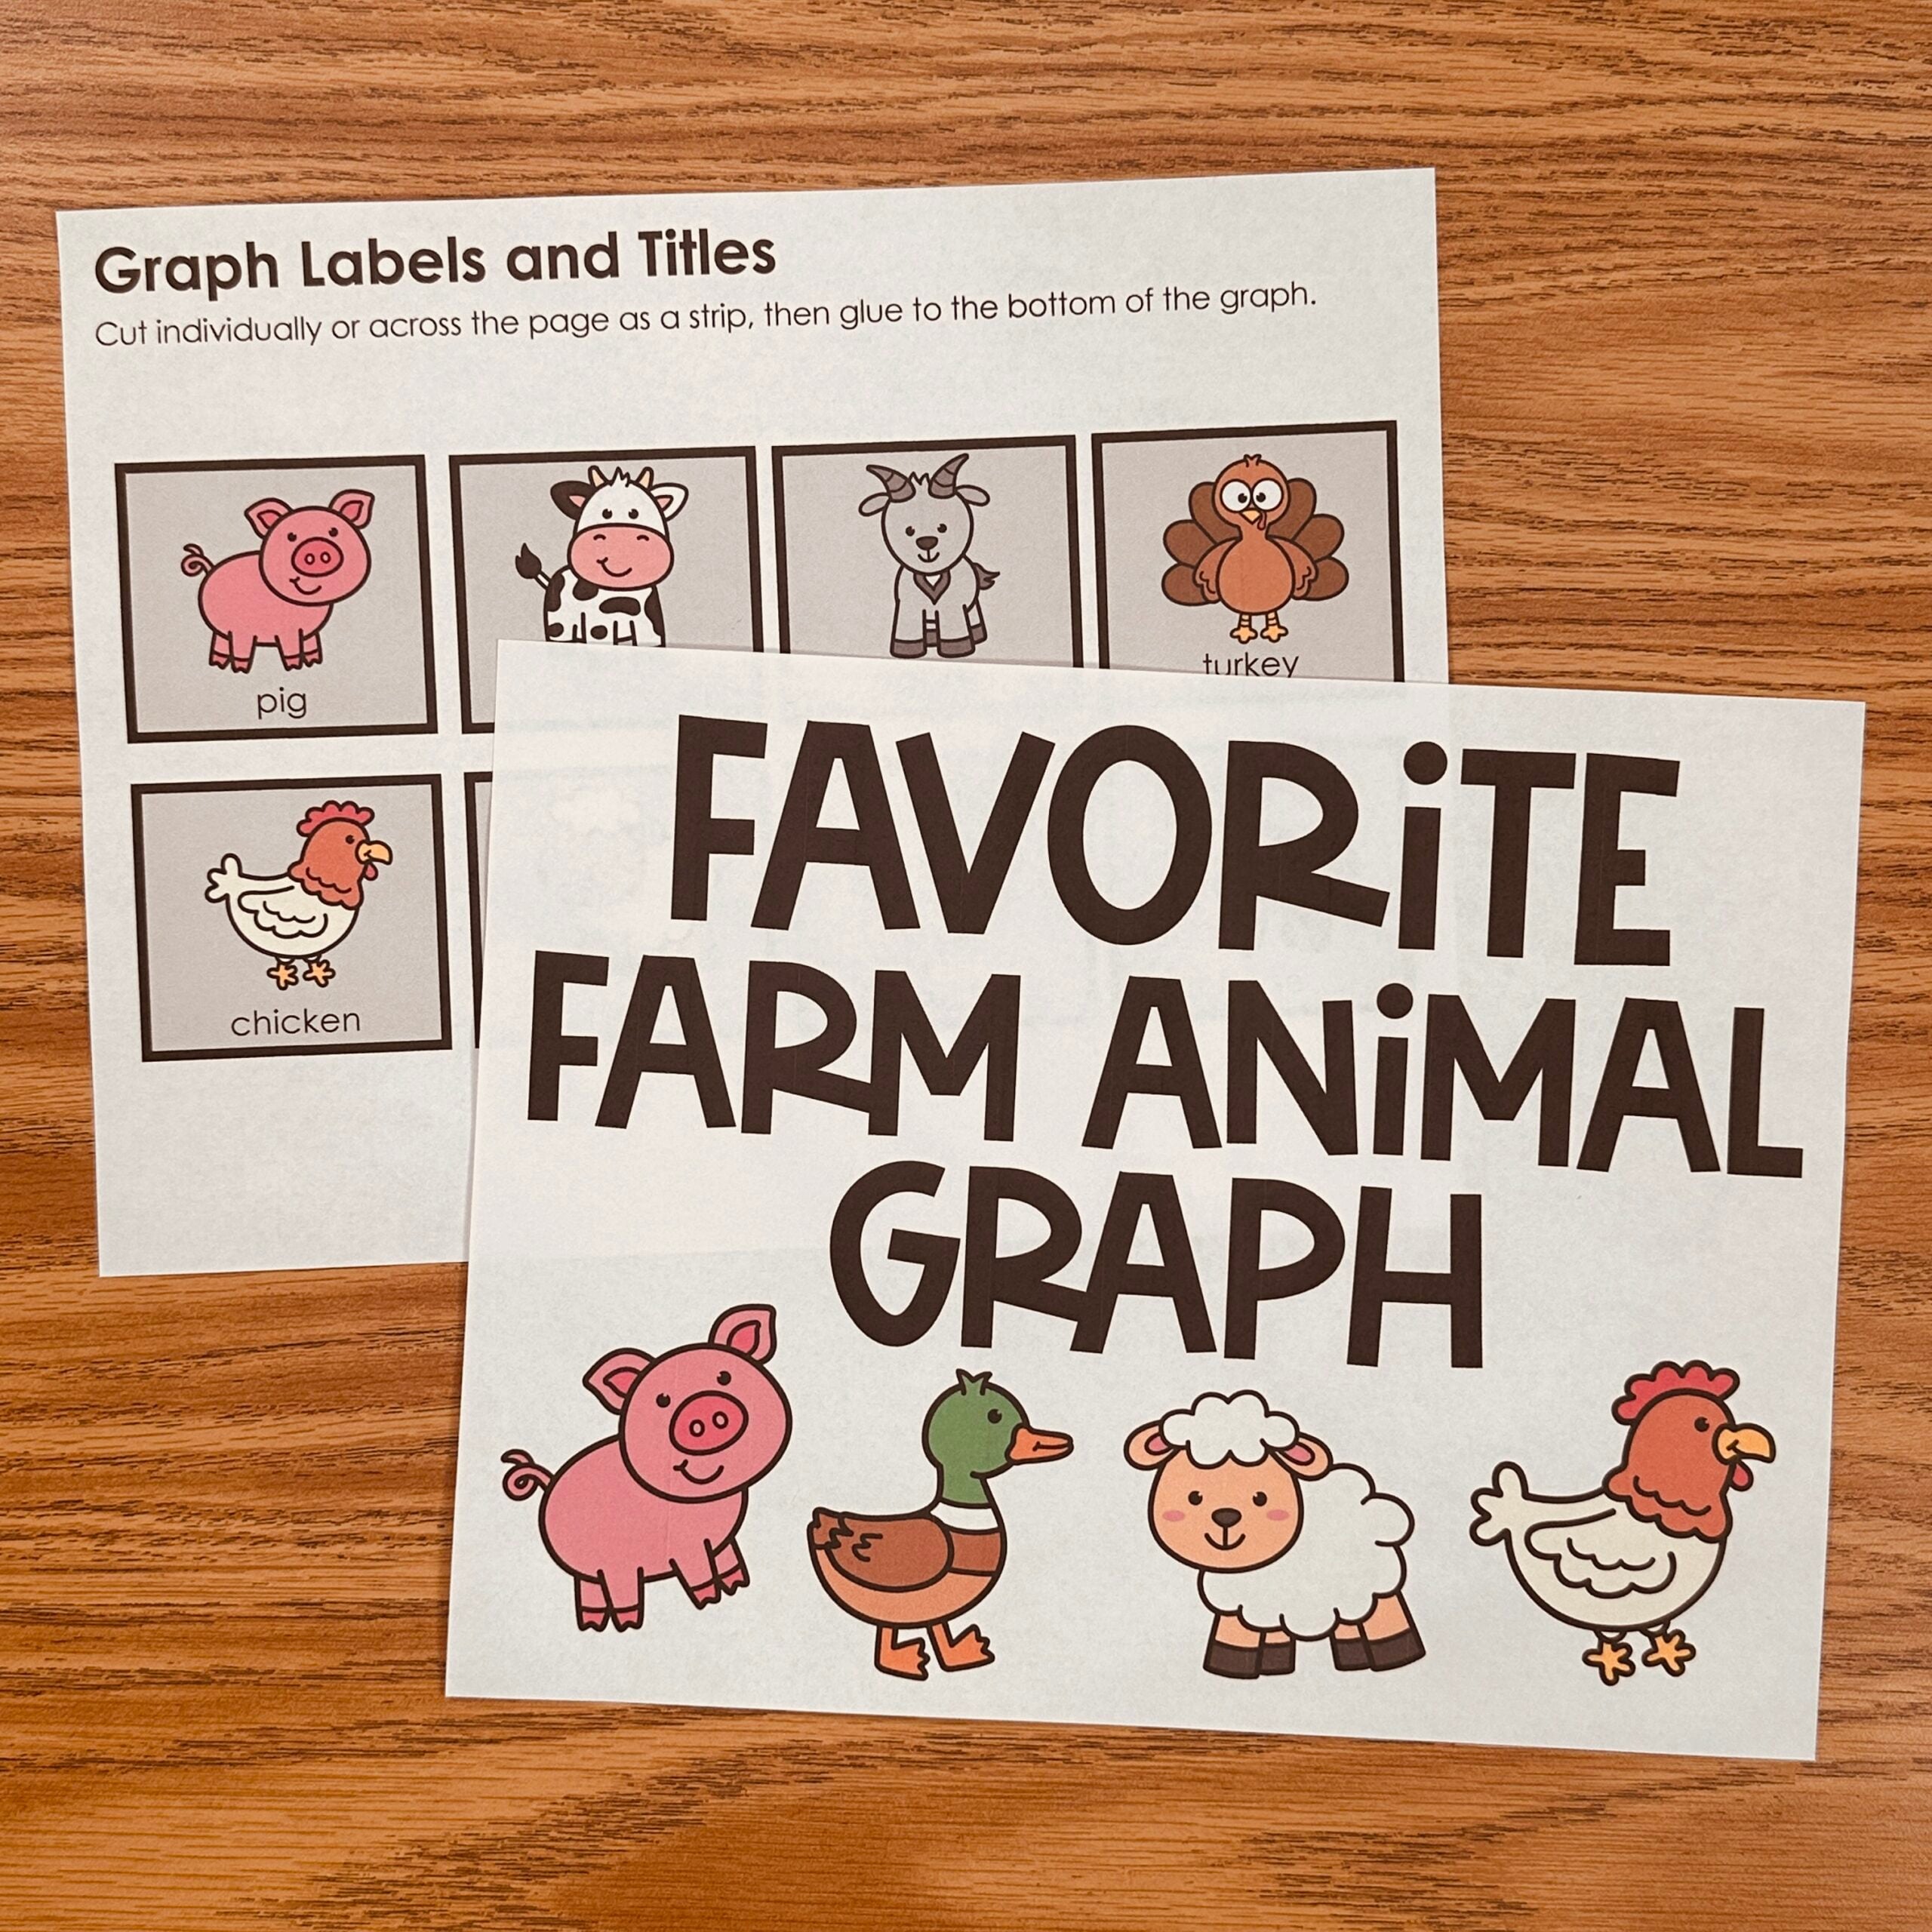
Zoo Class Graph
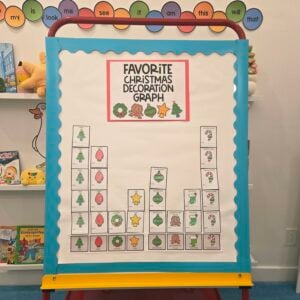
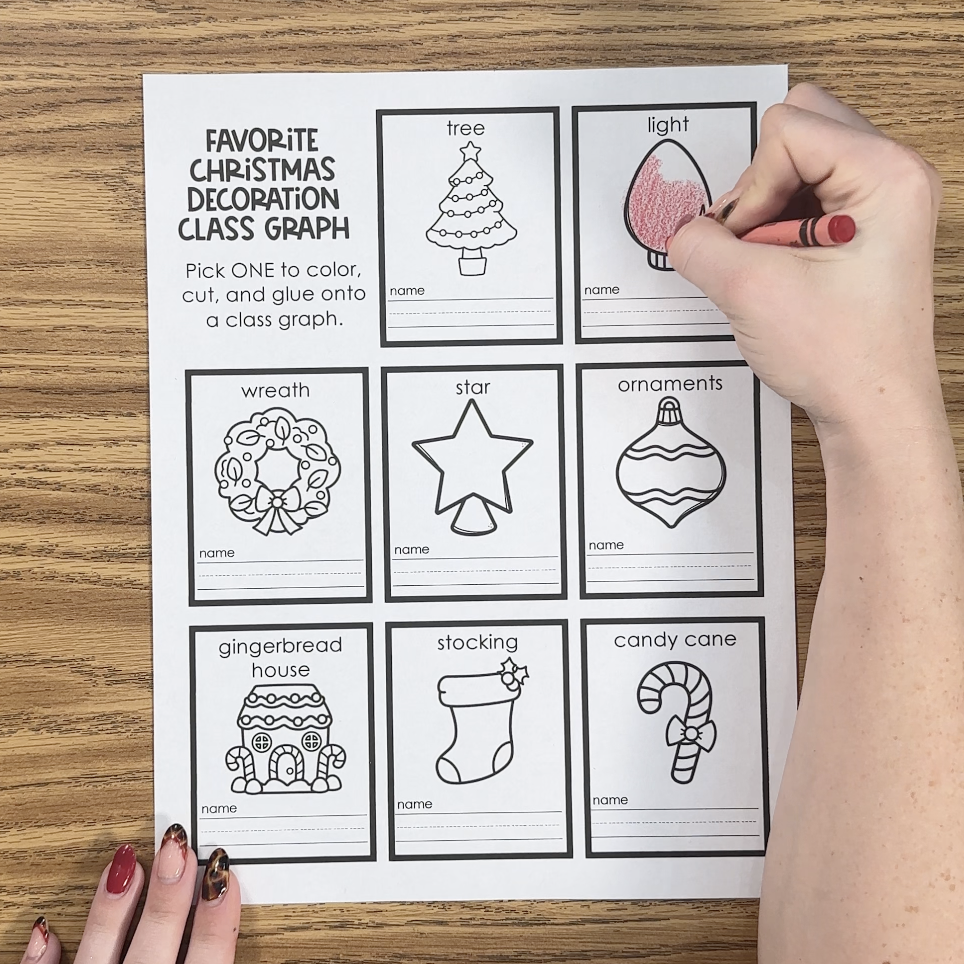
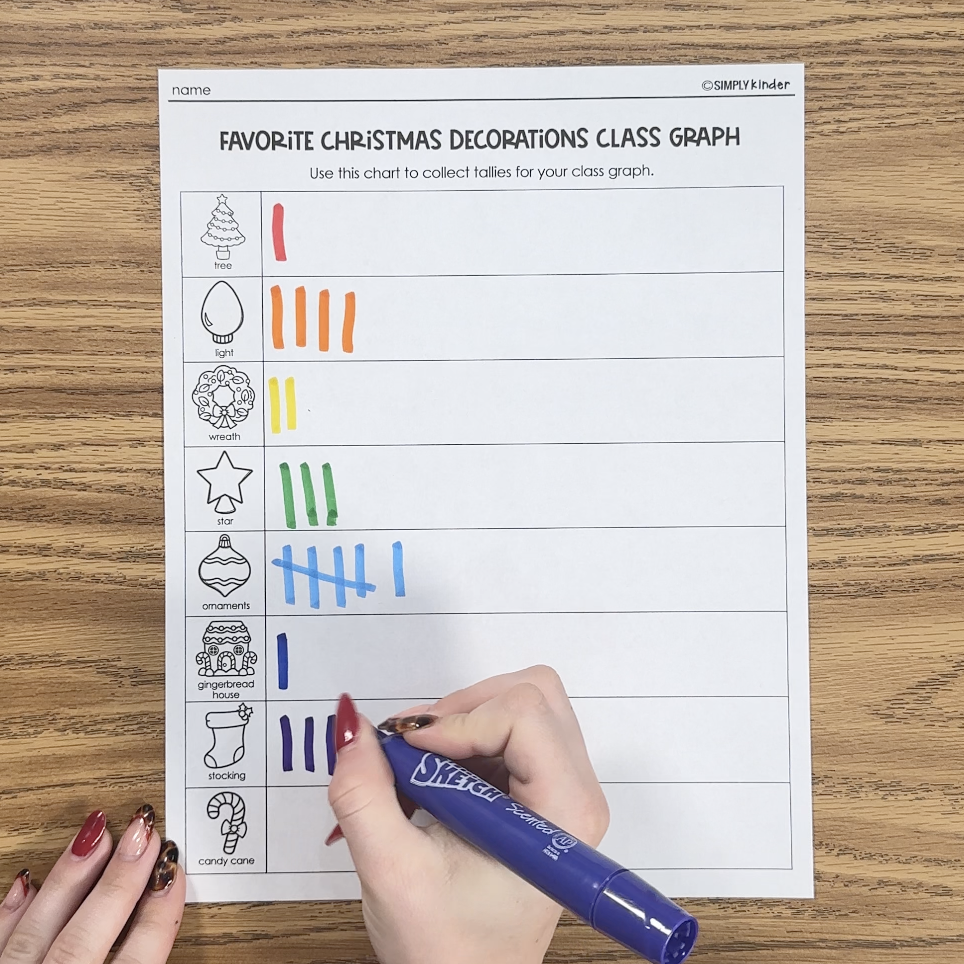
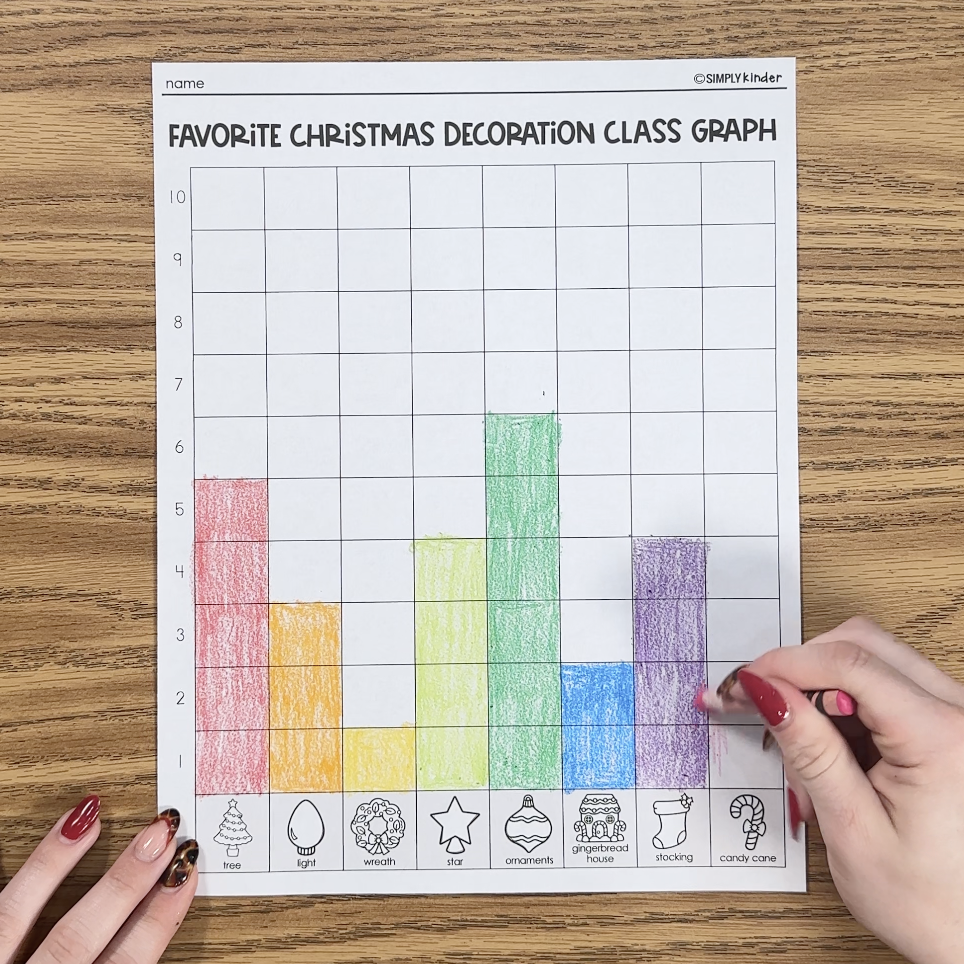
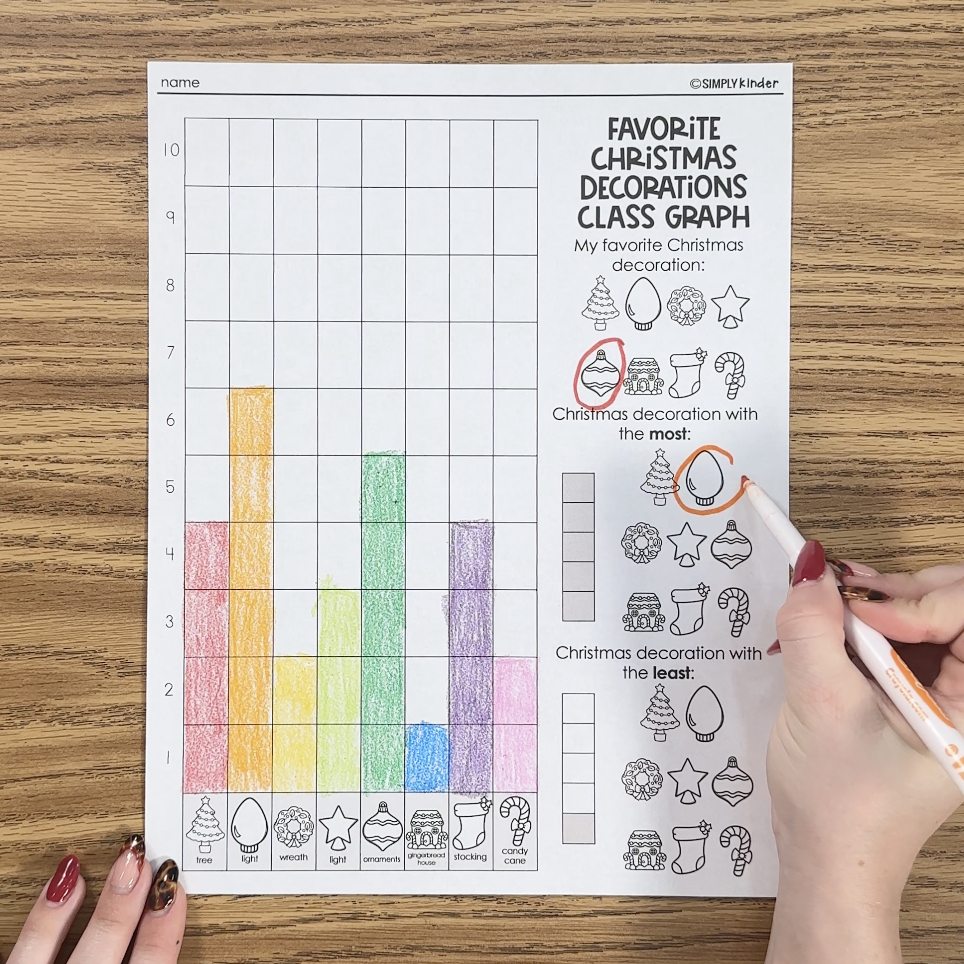
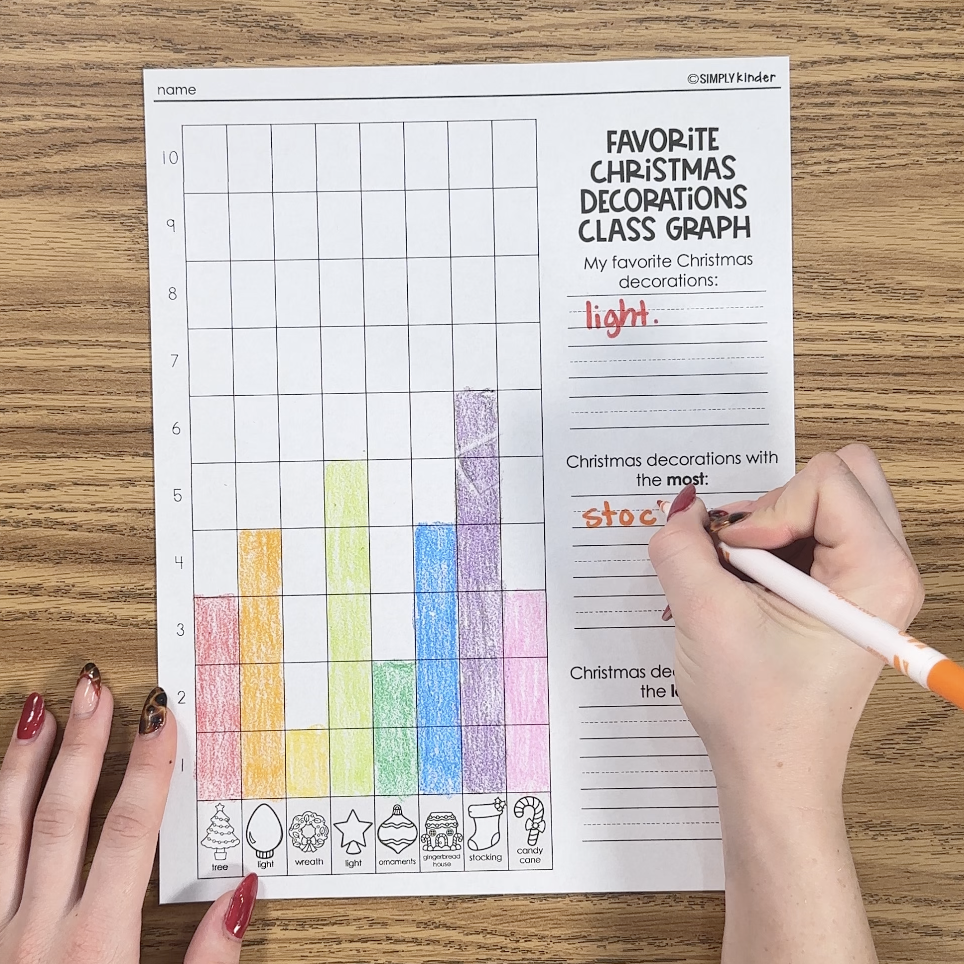
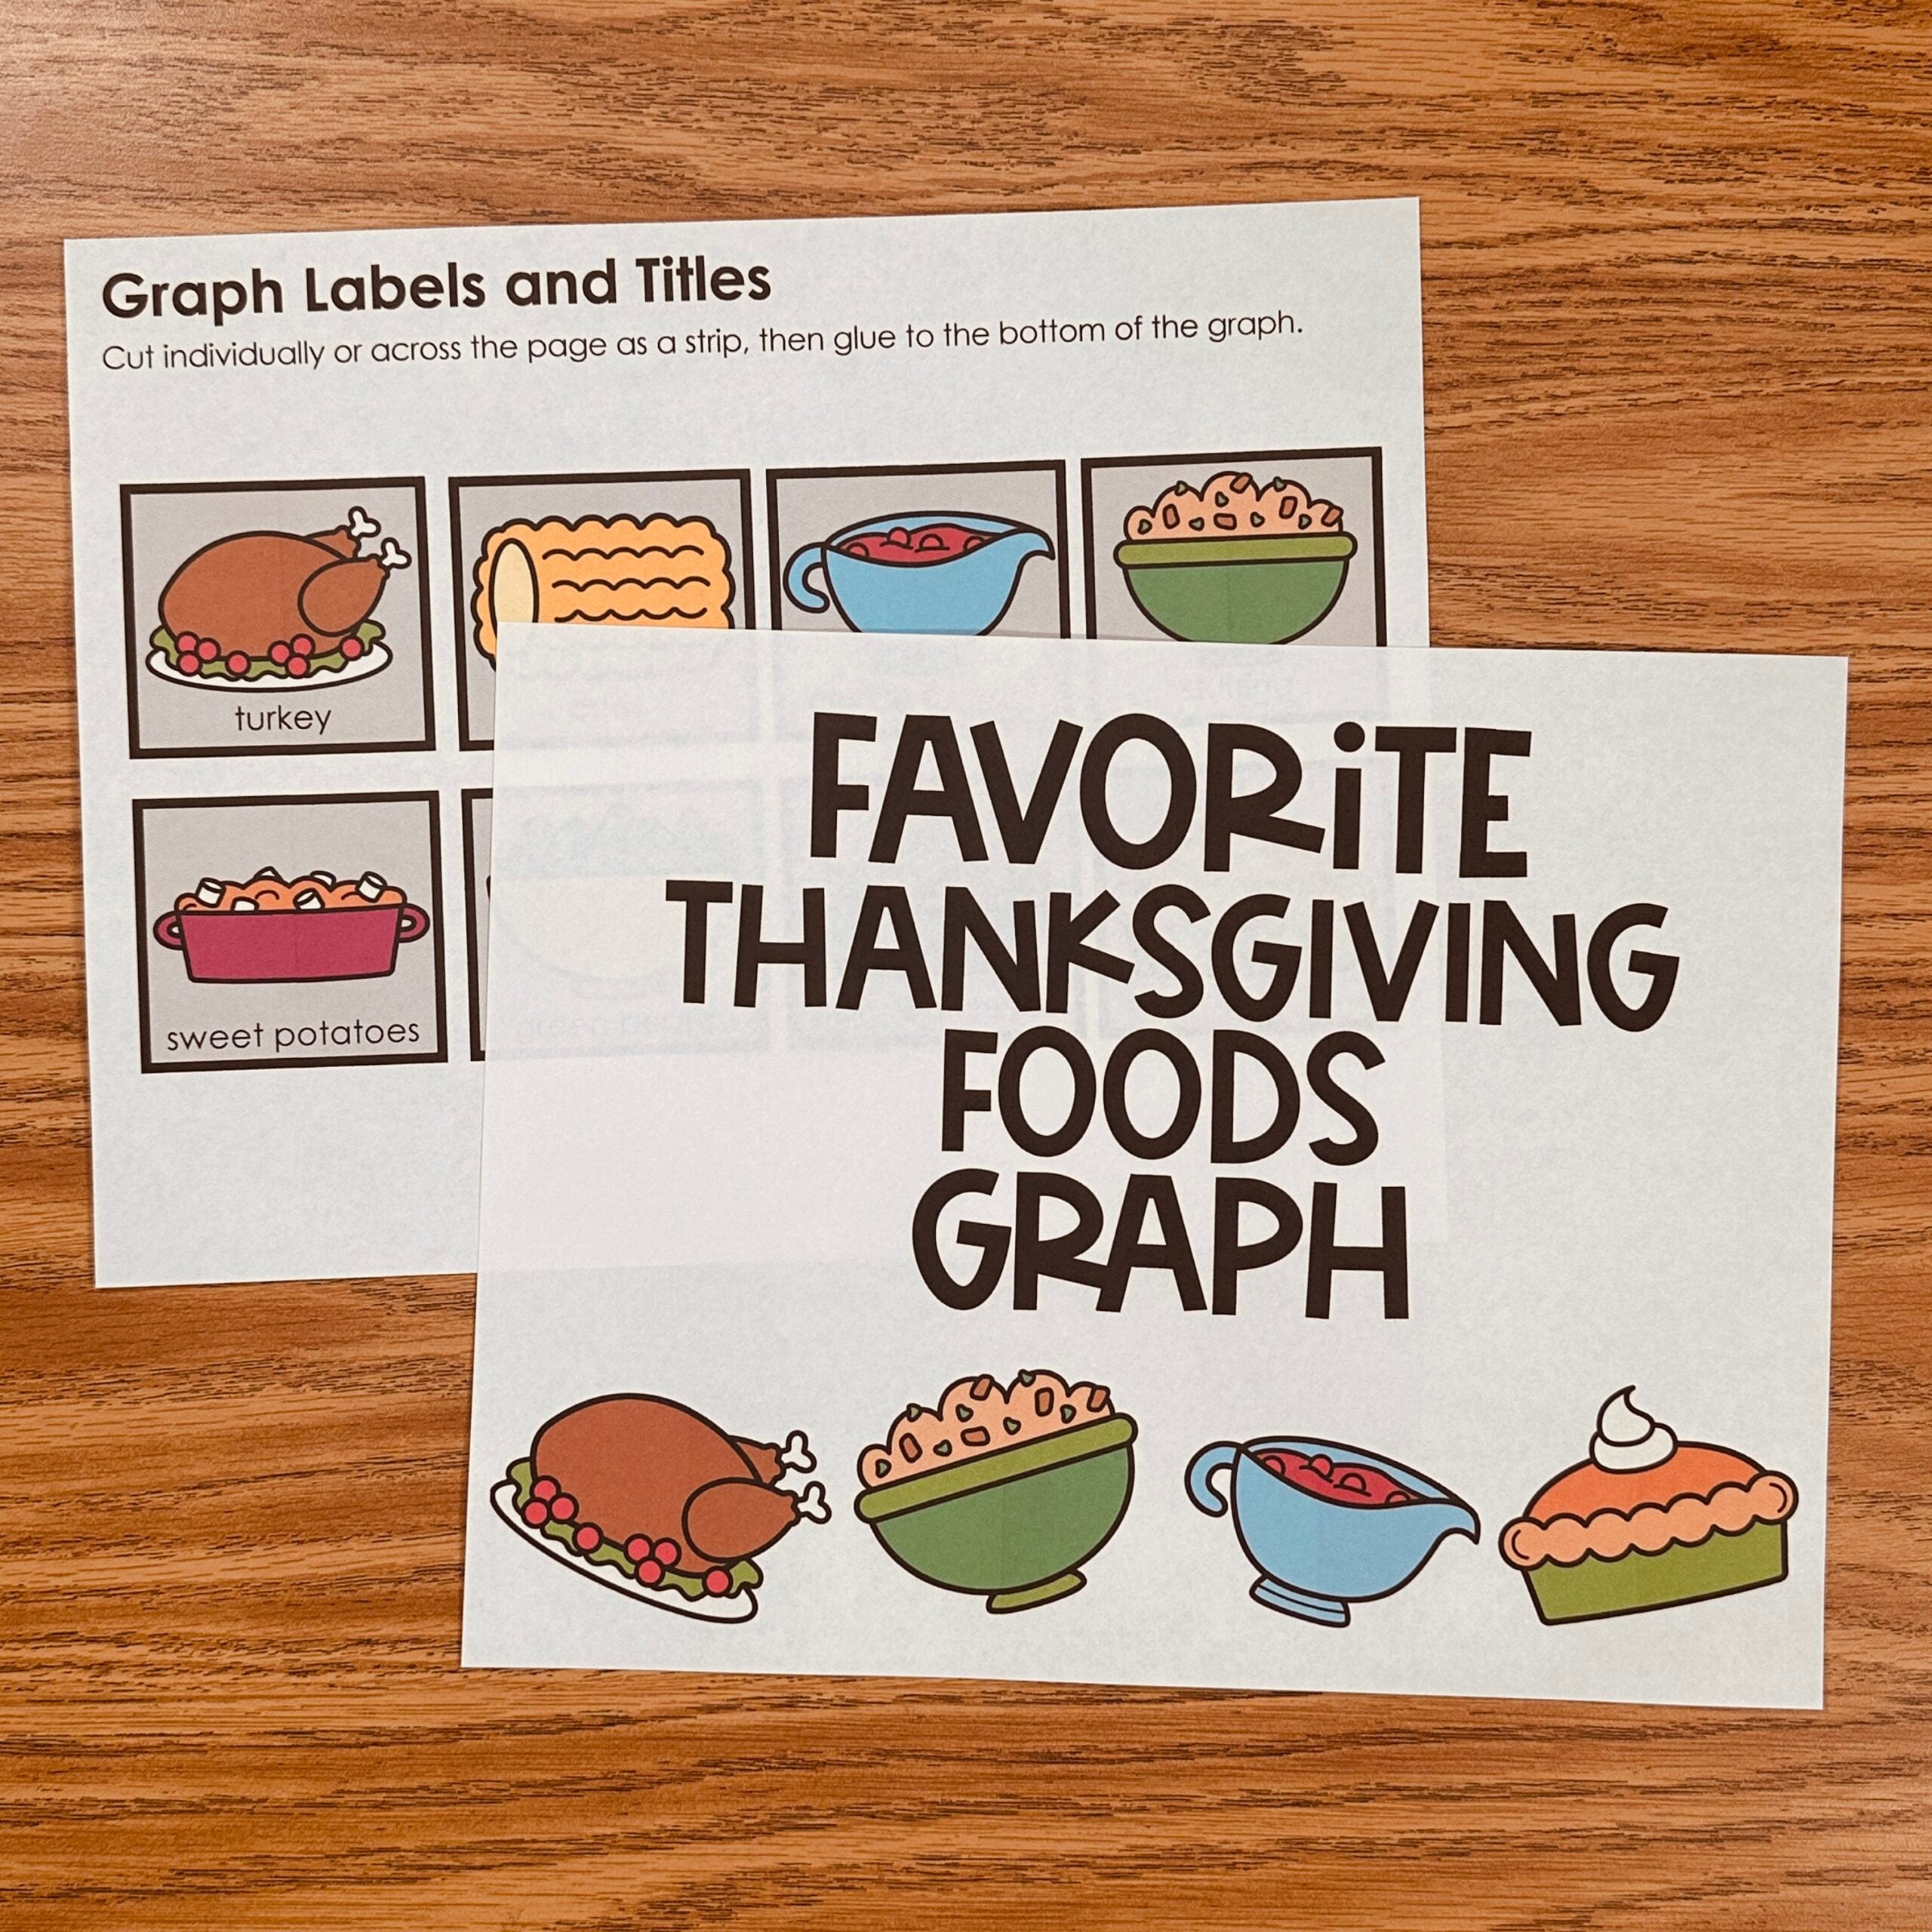
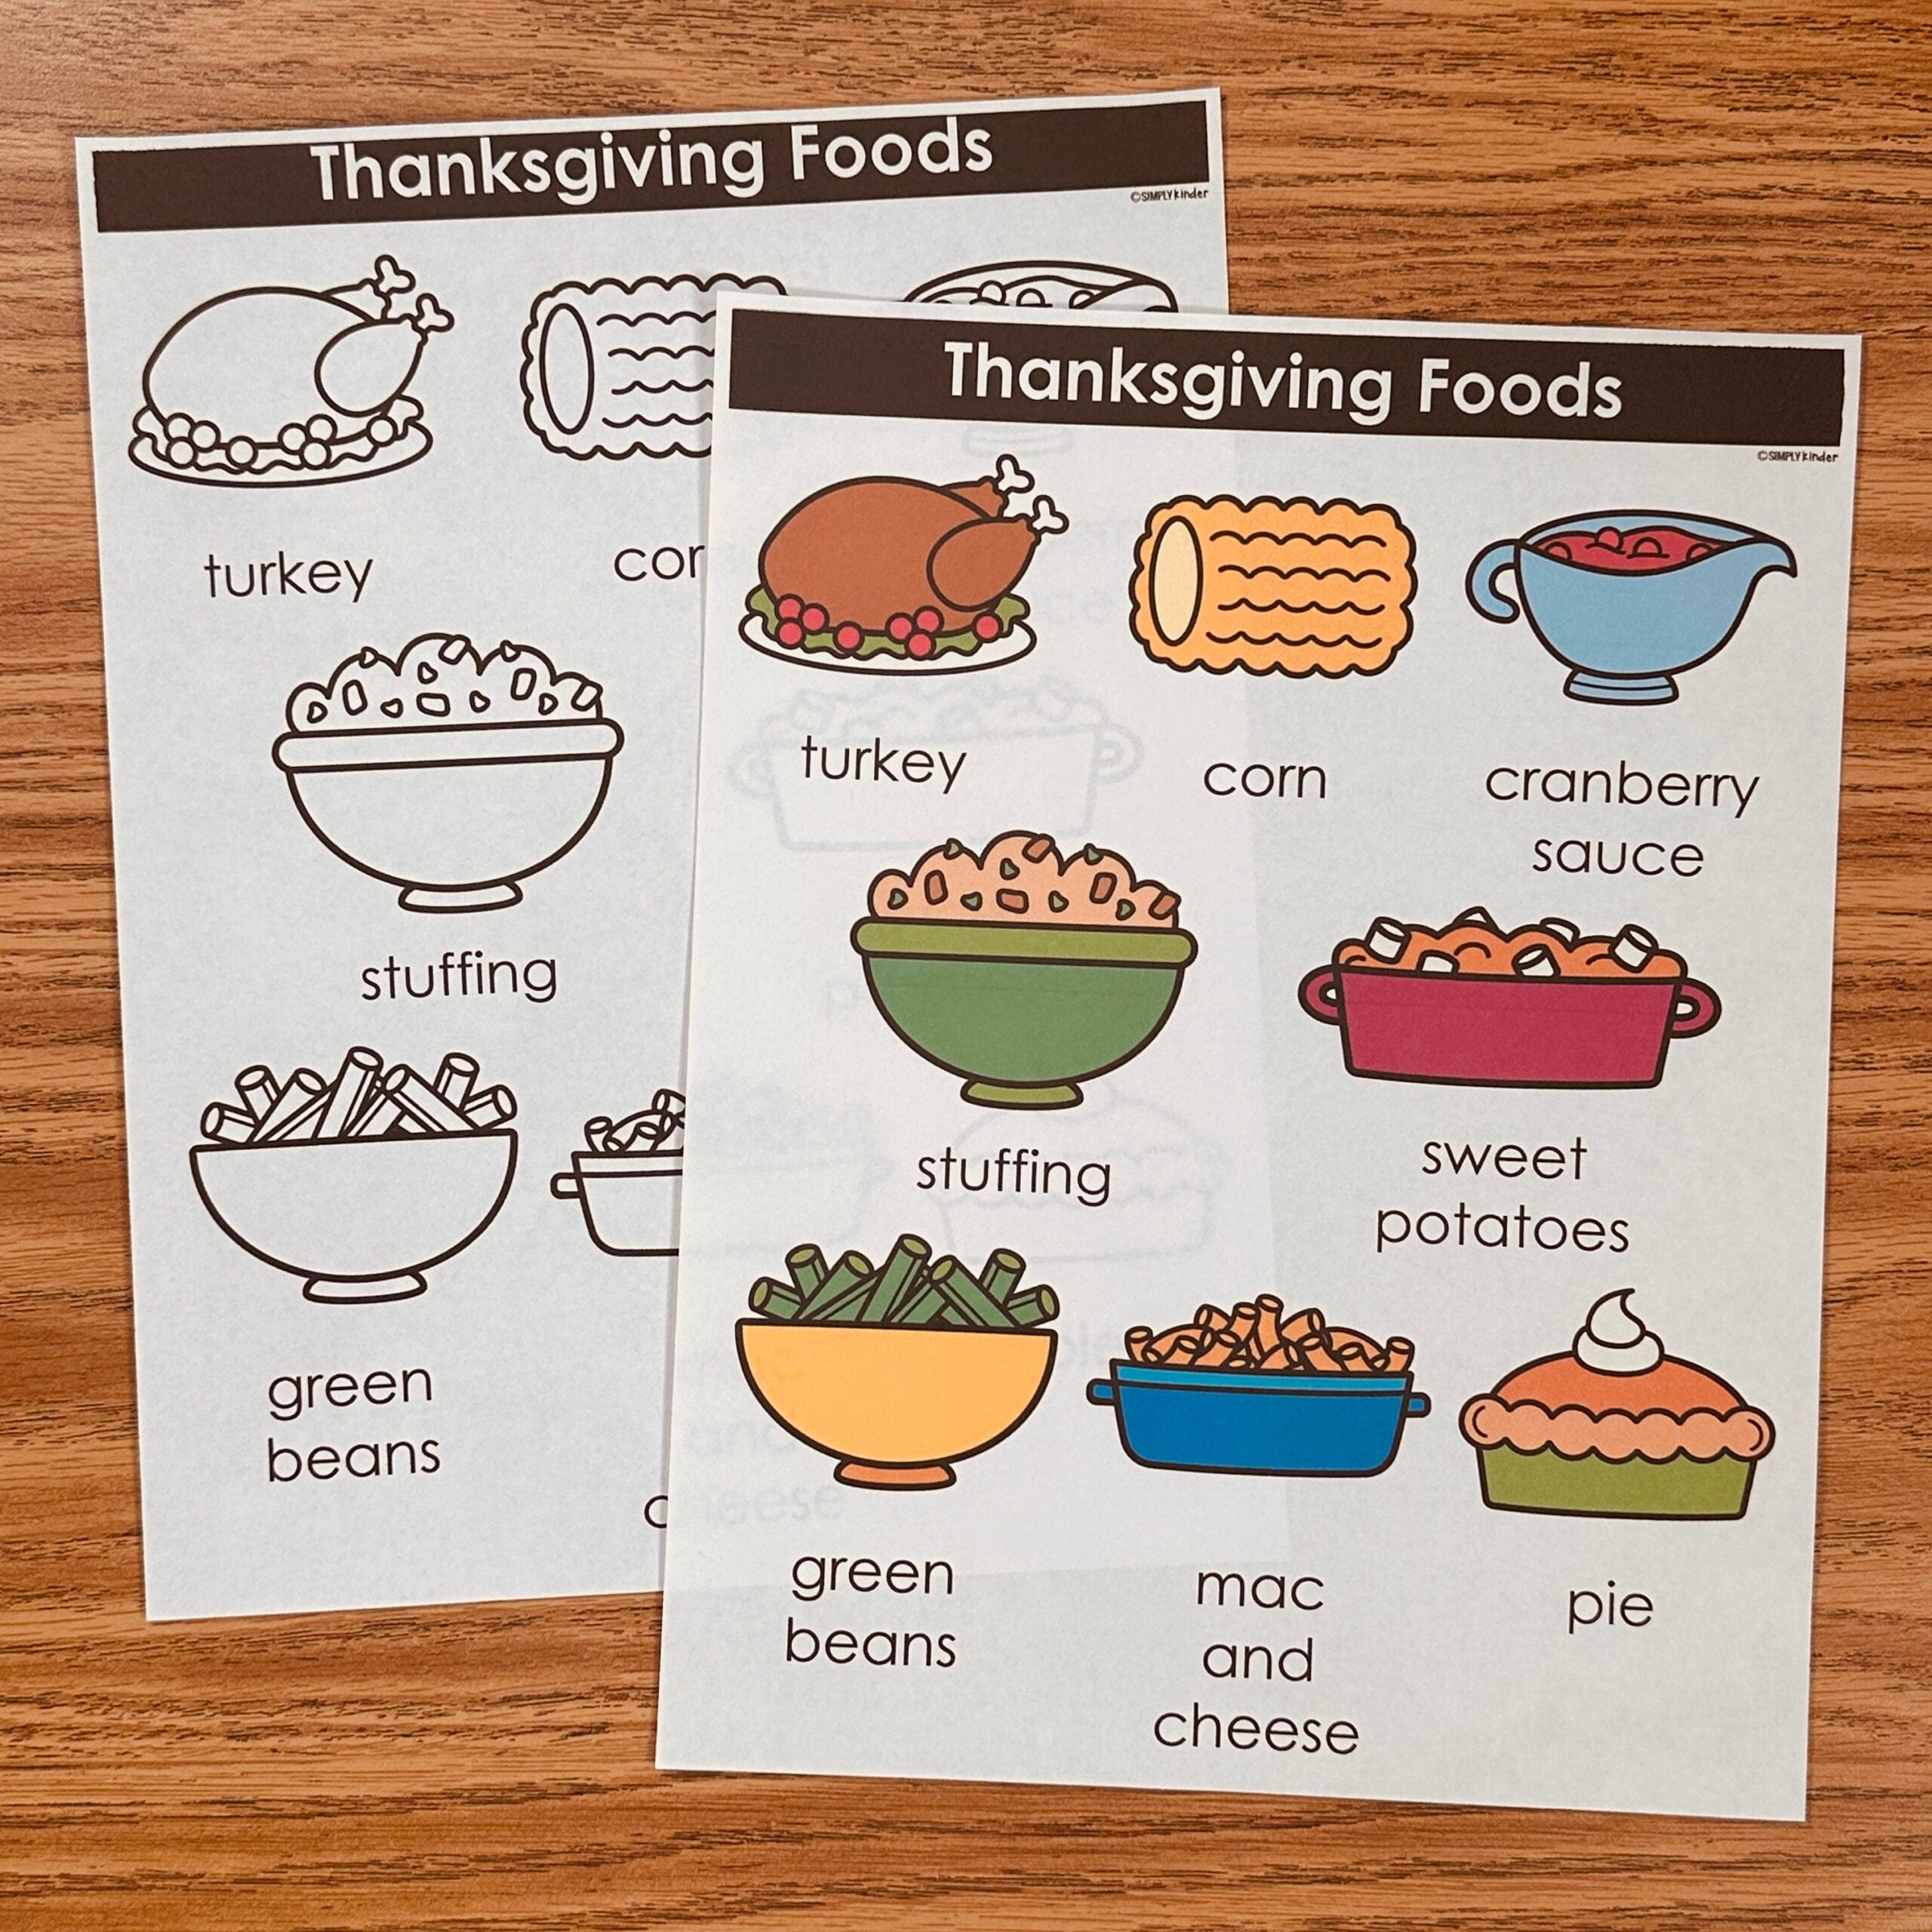
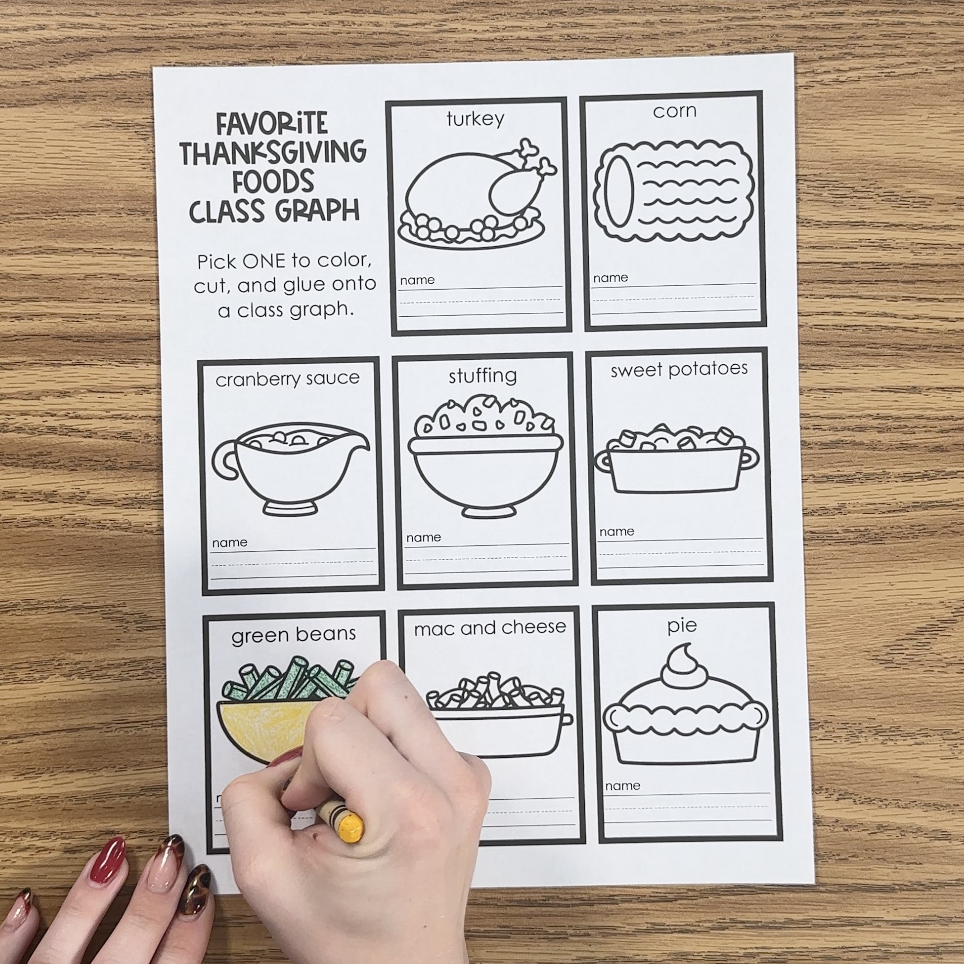
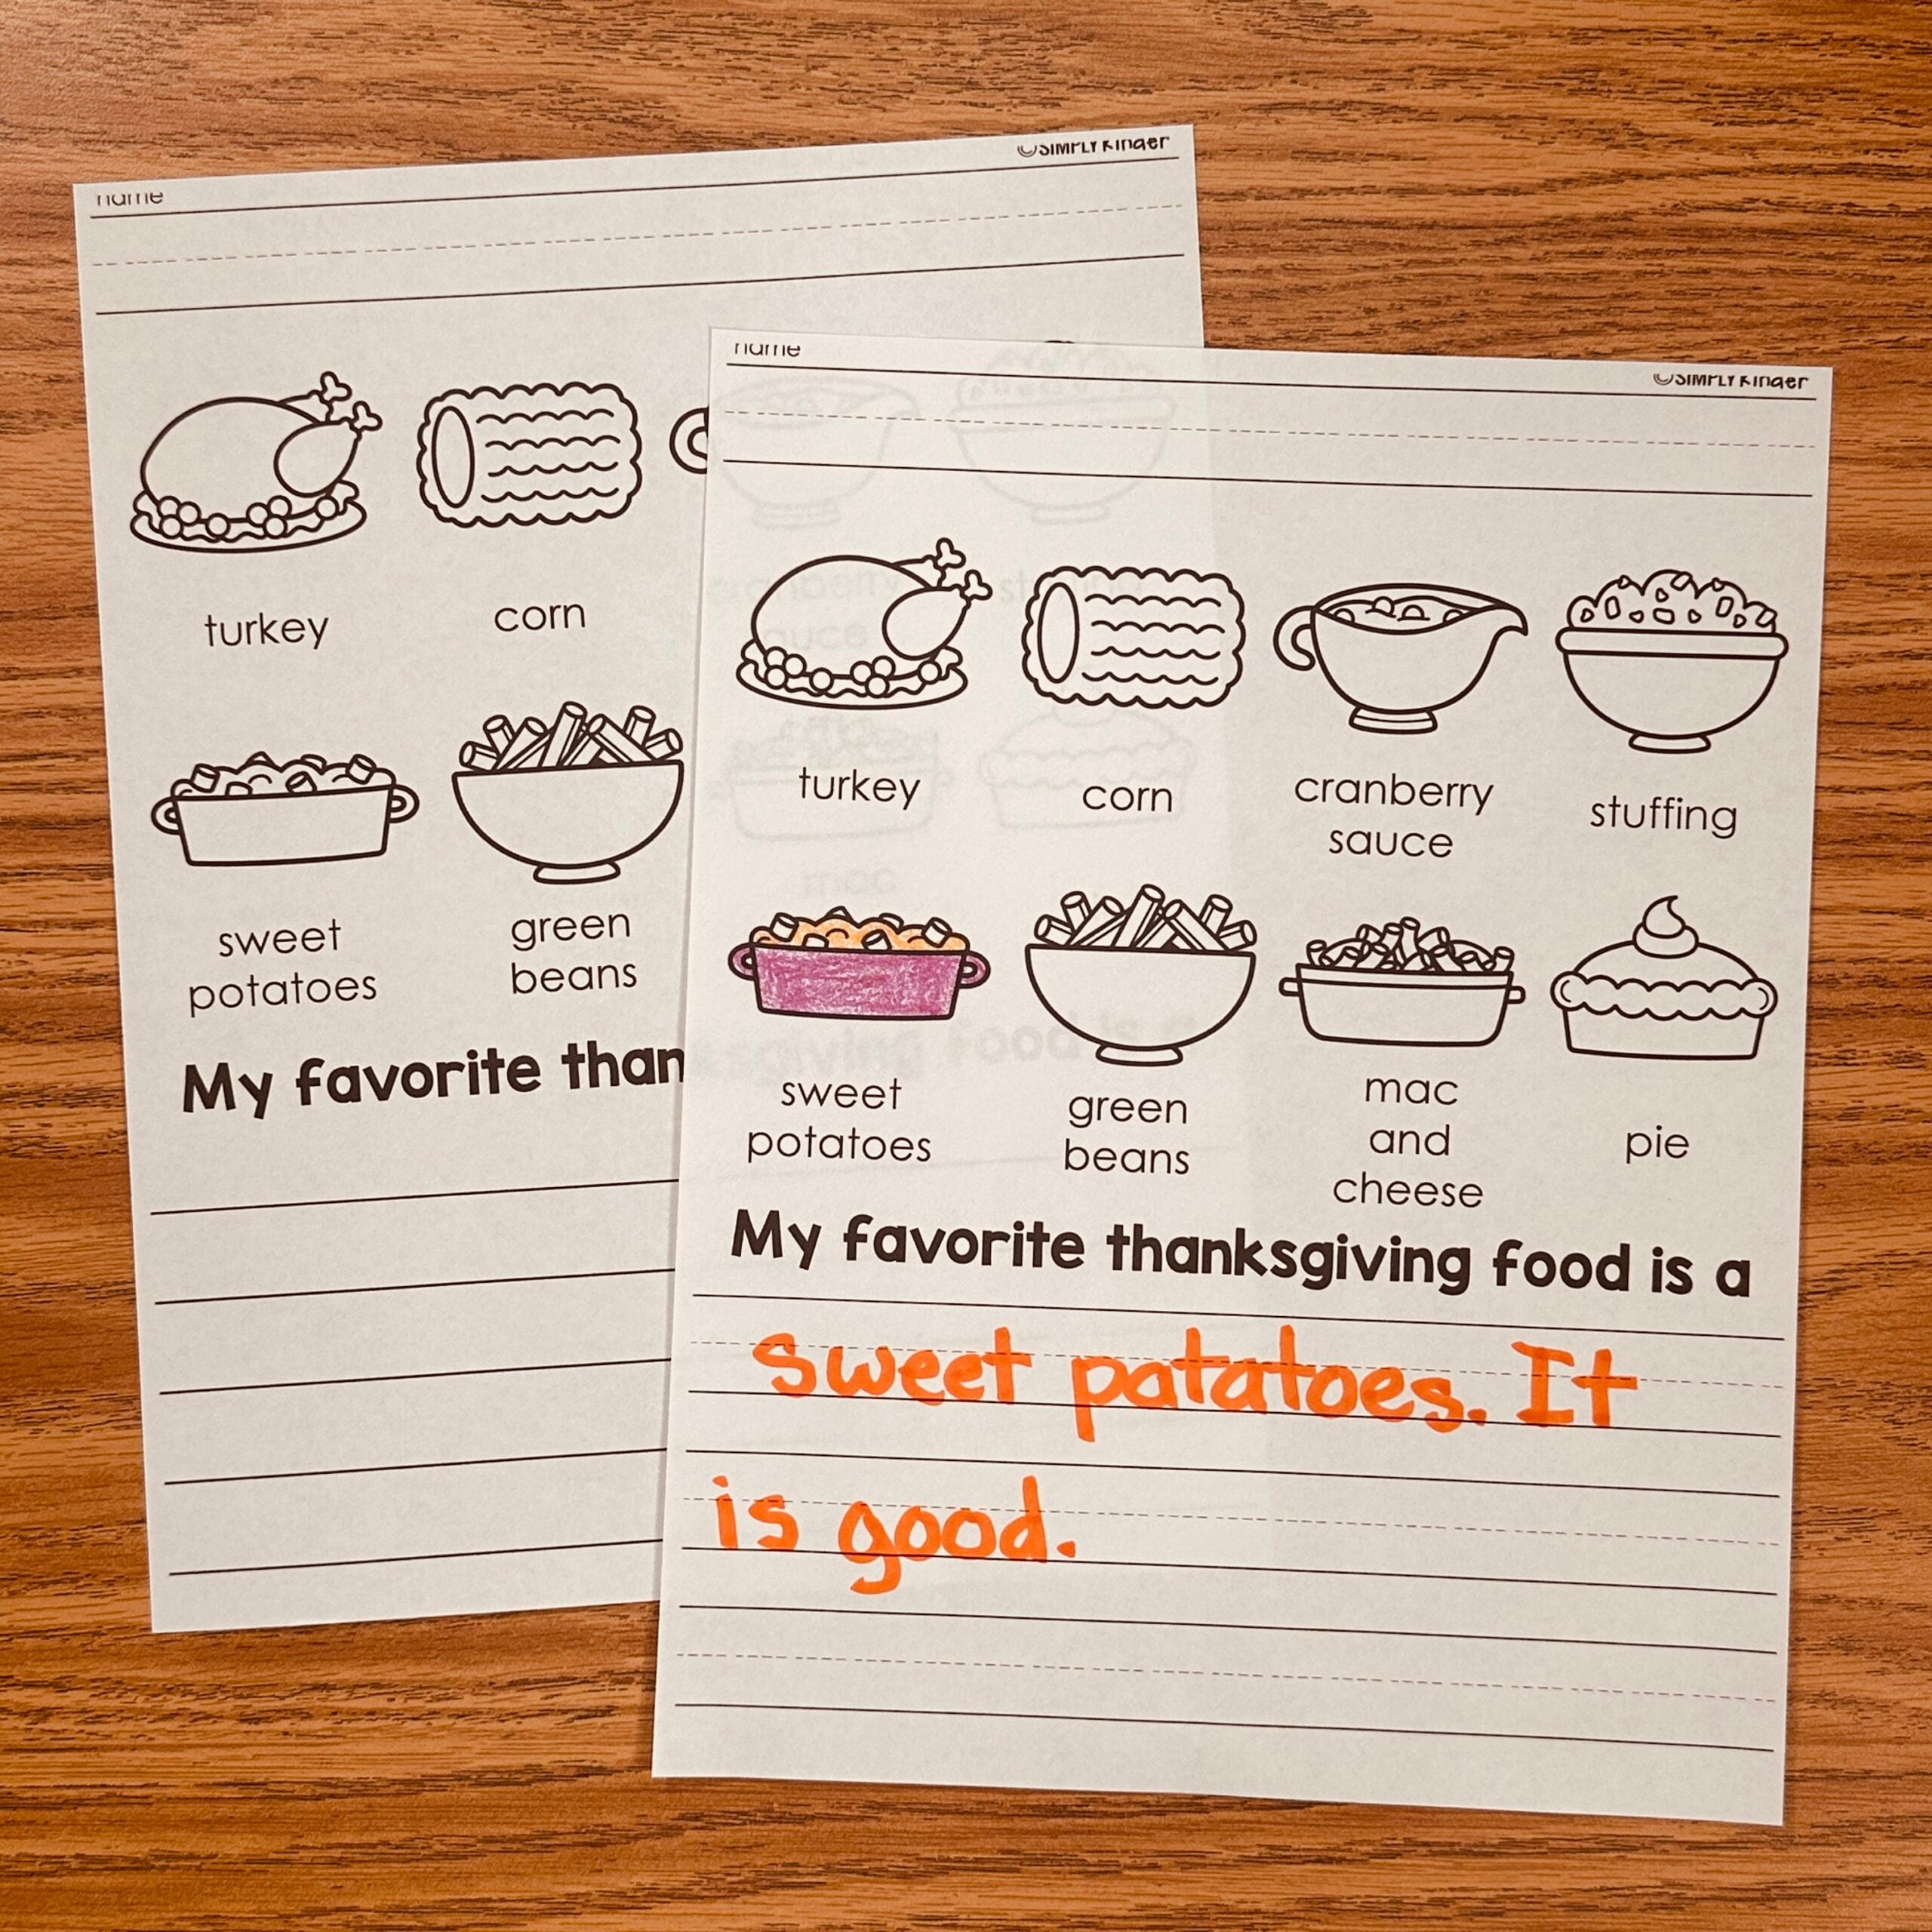
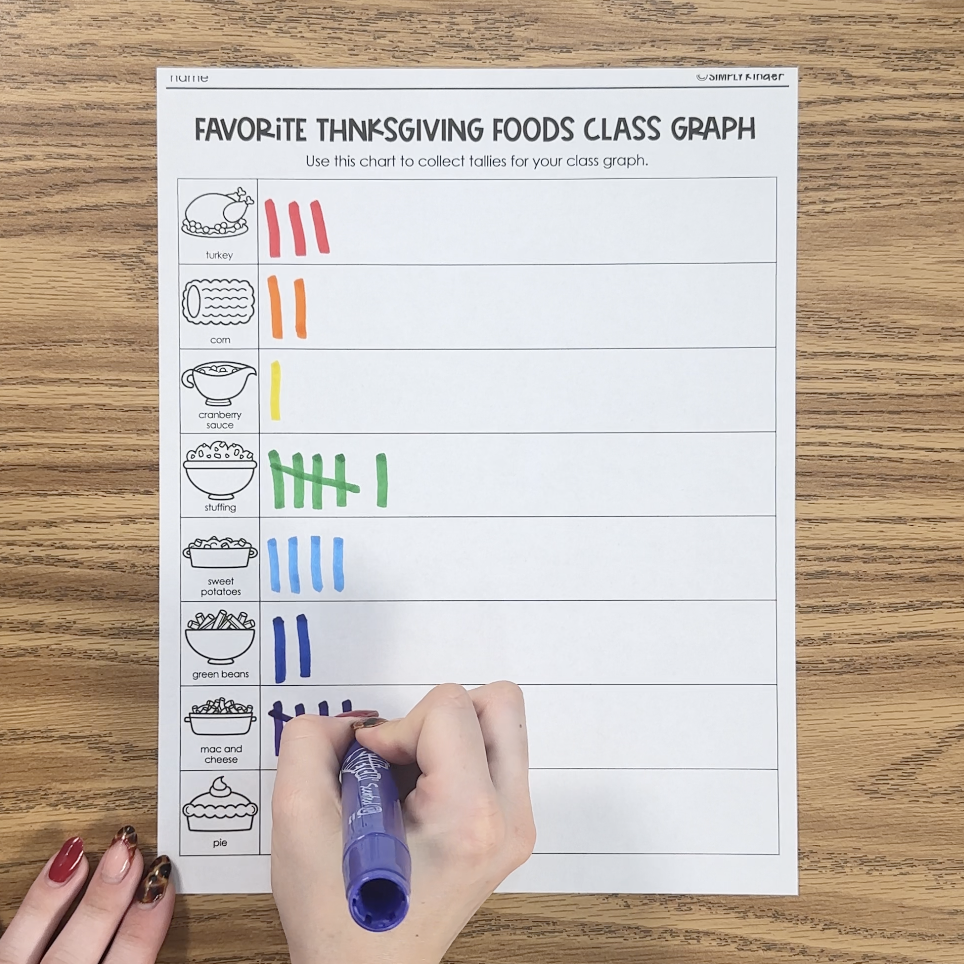
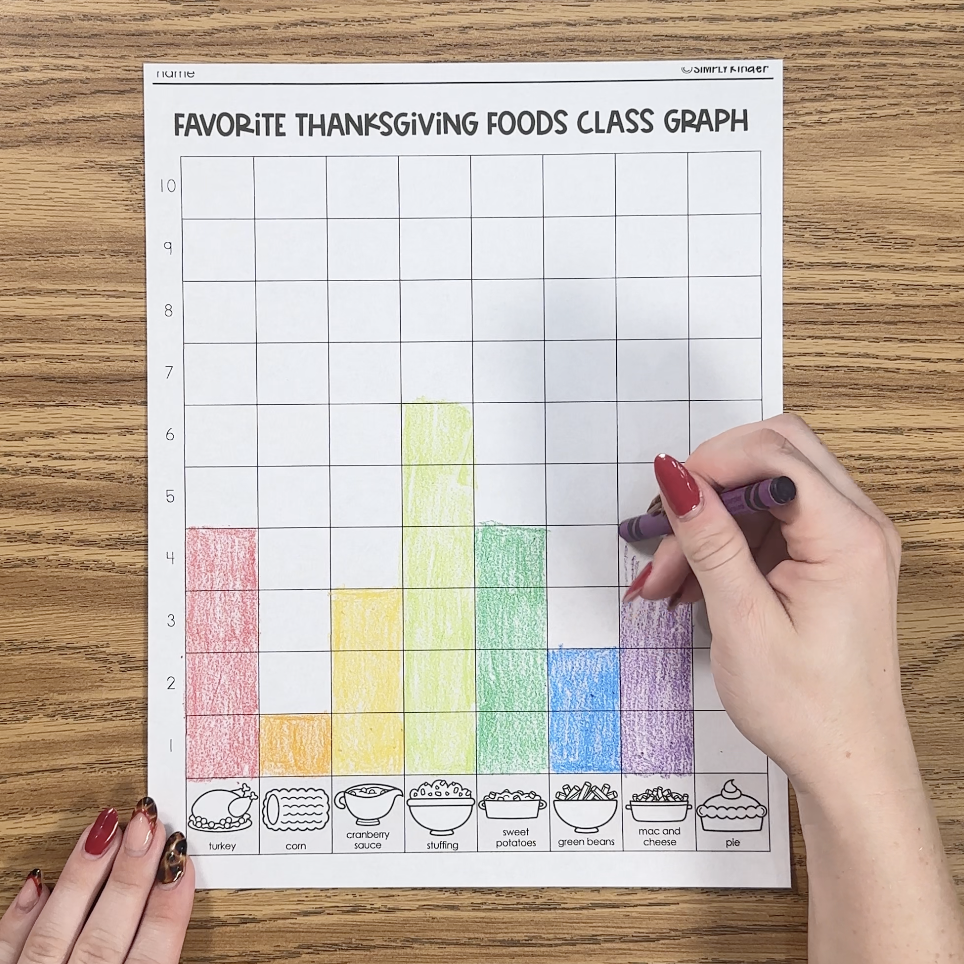
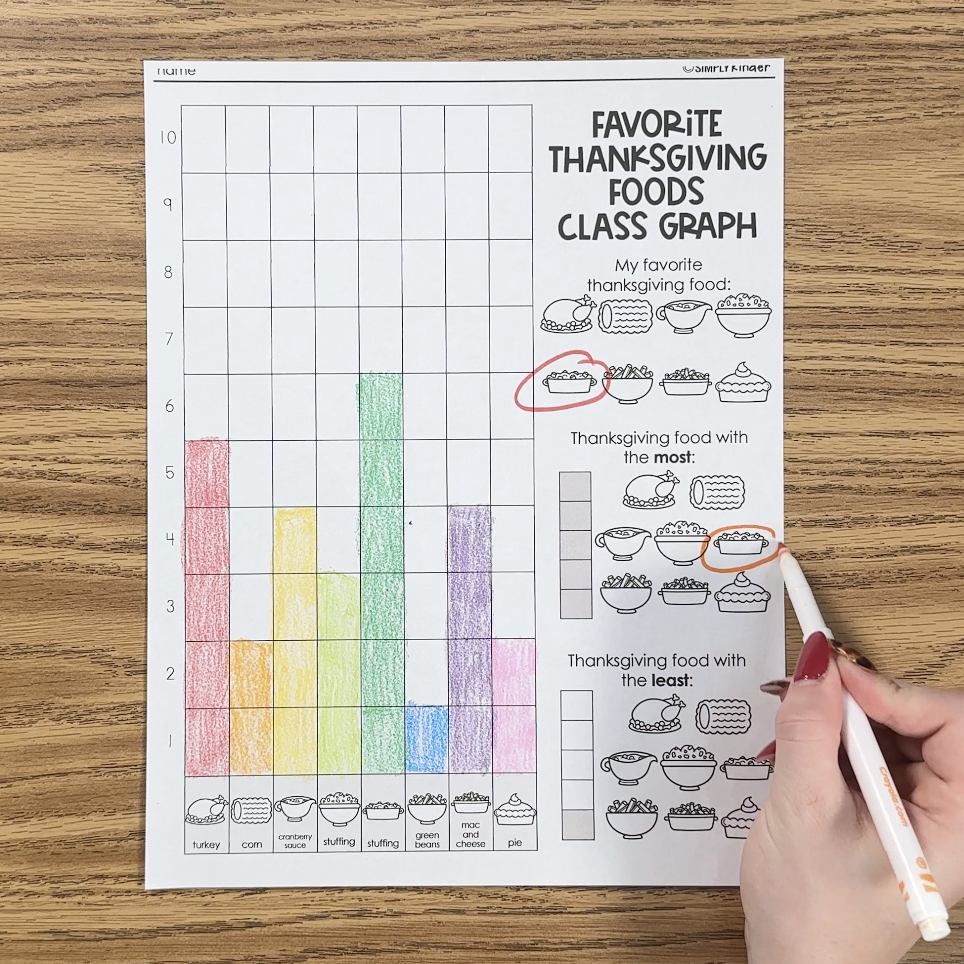
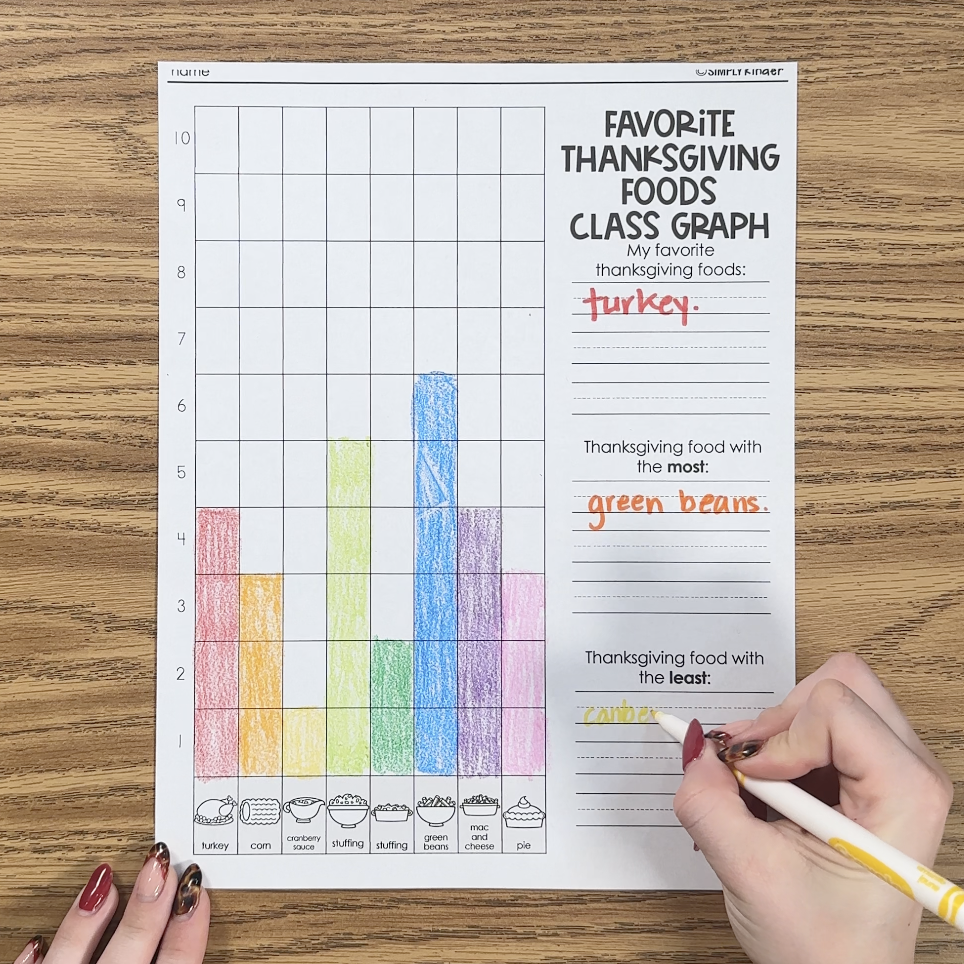
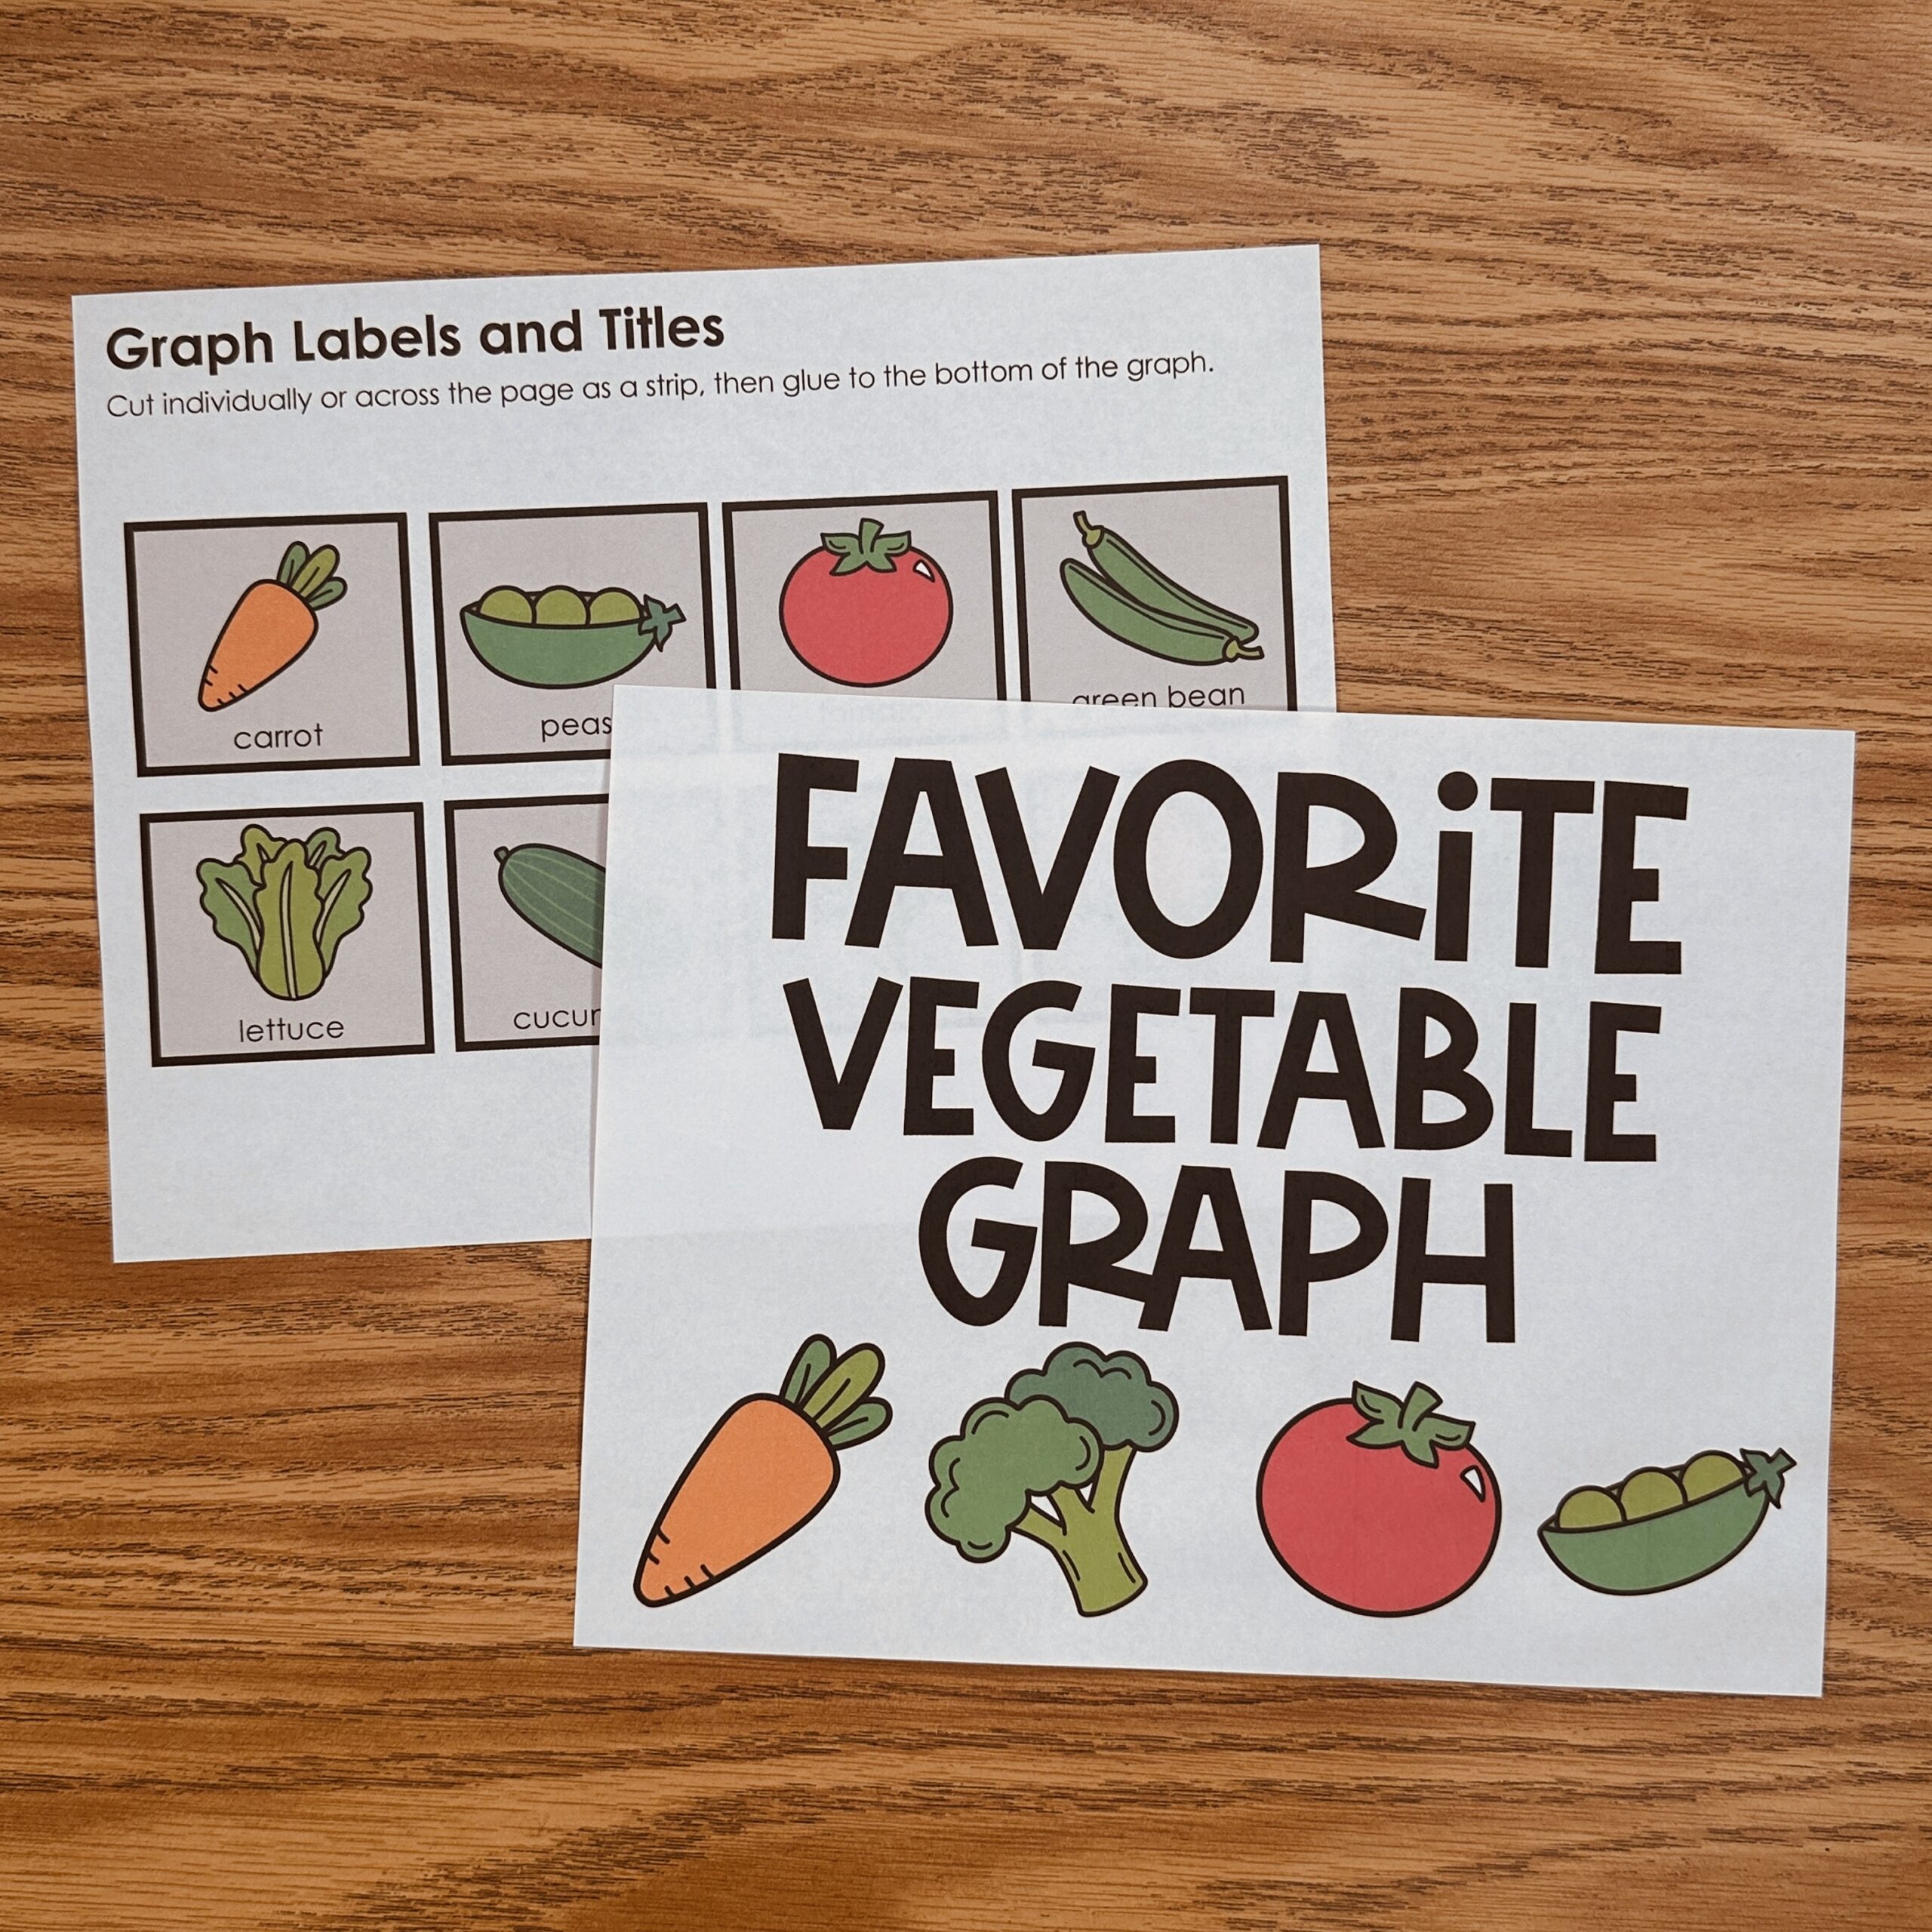
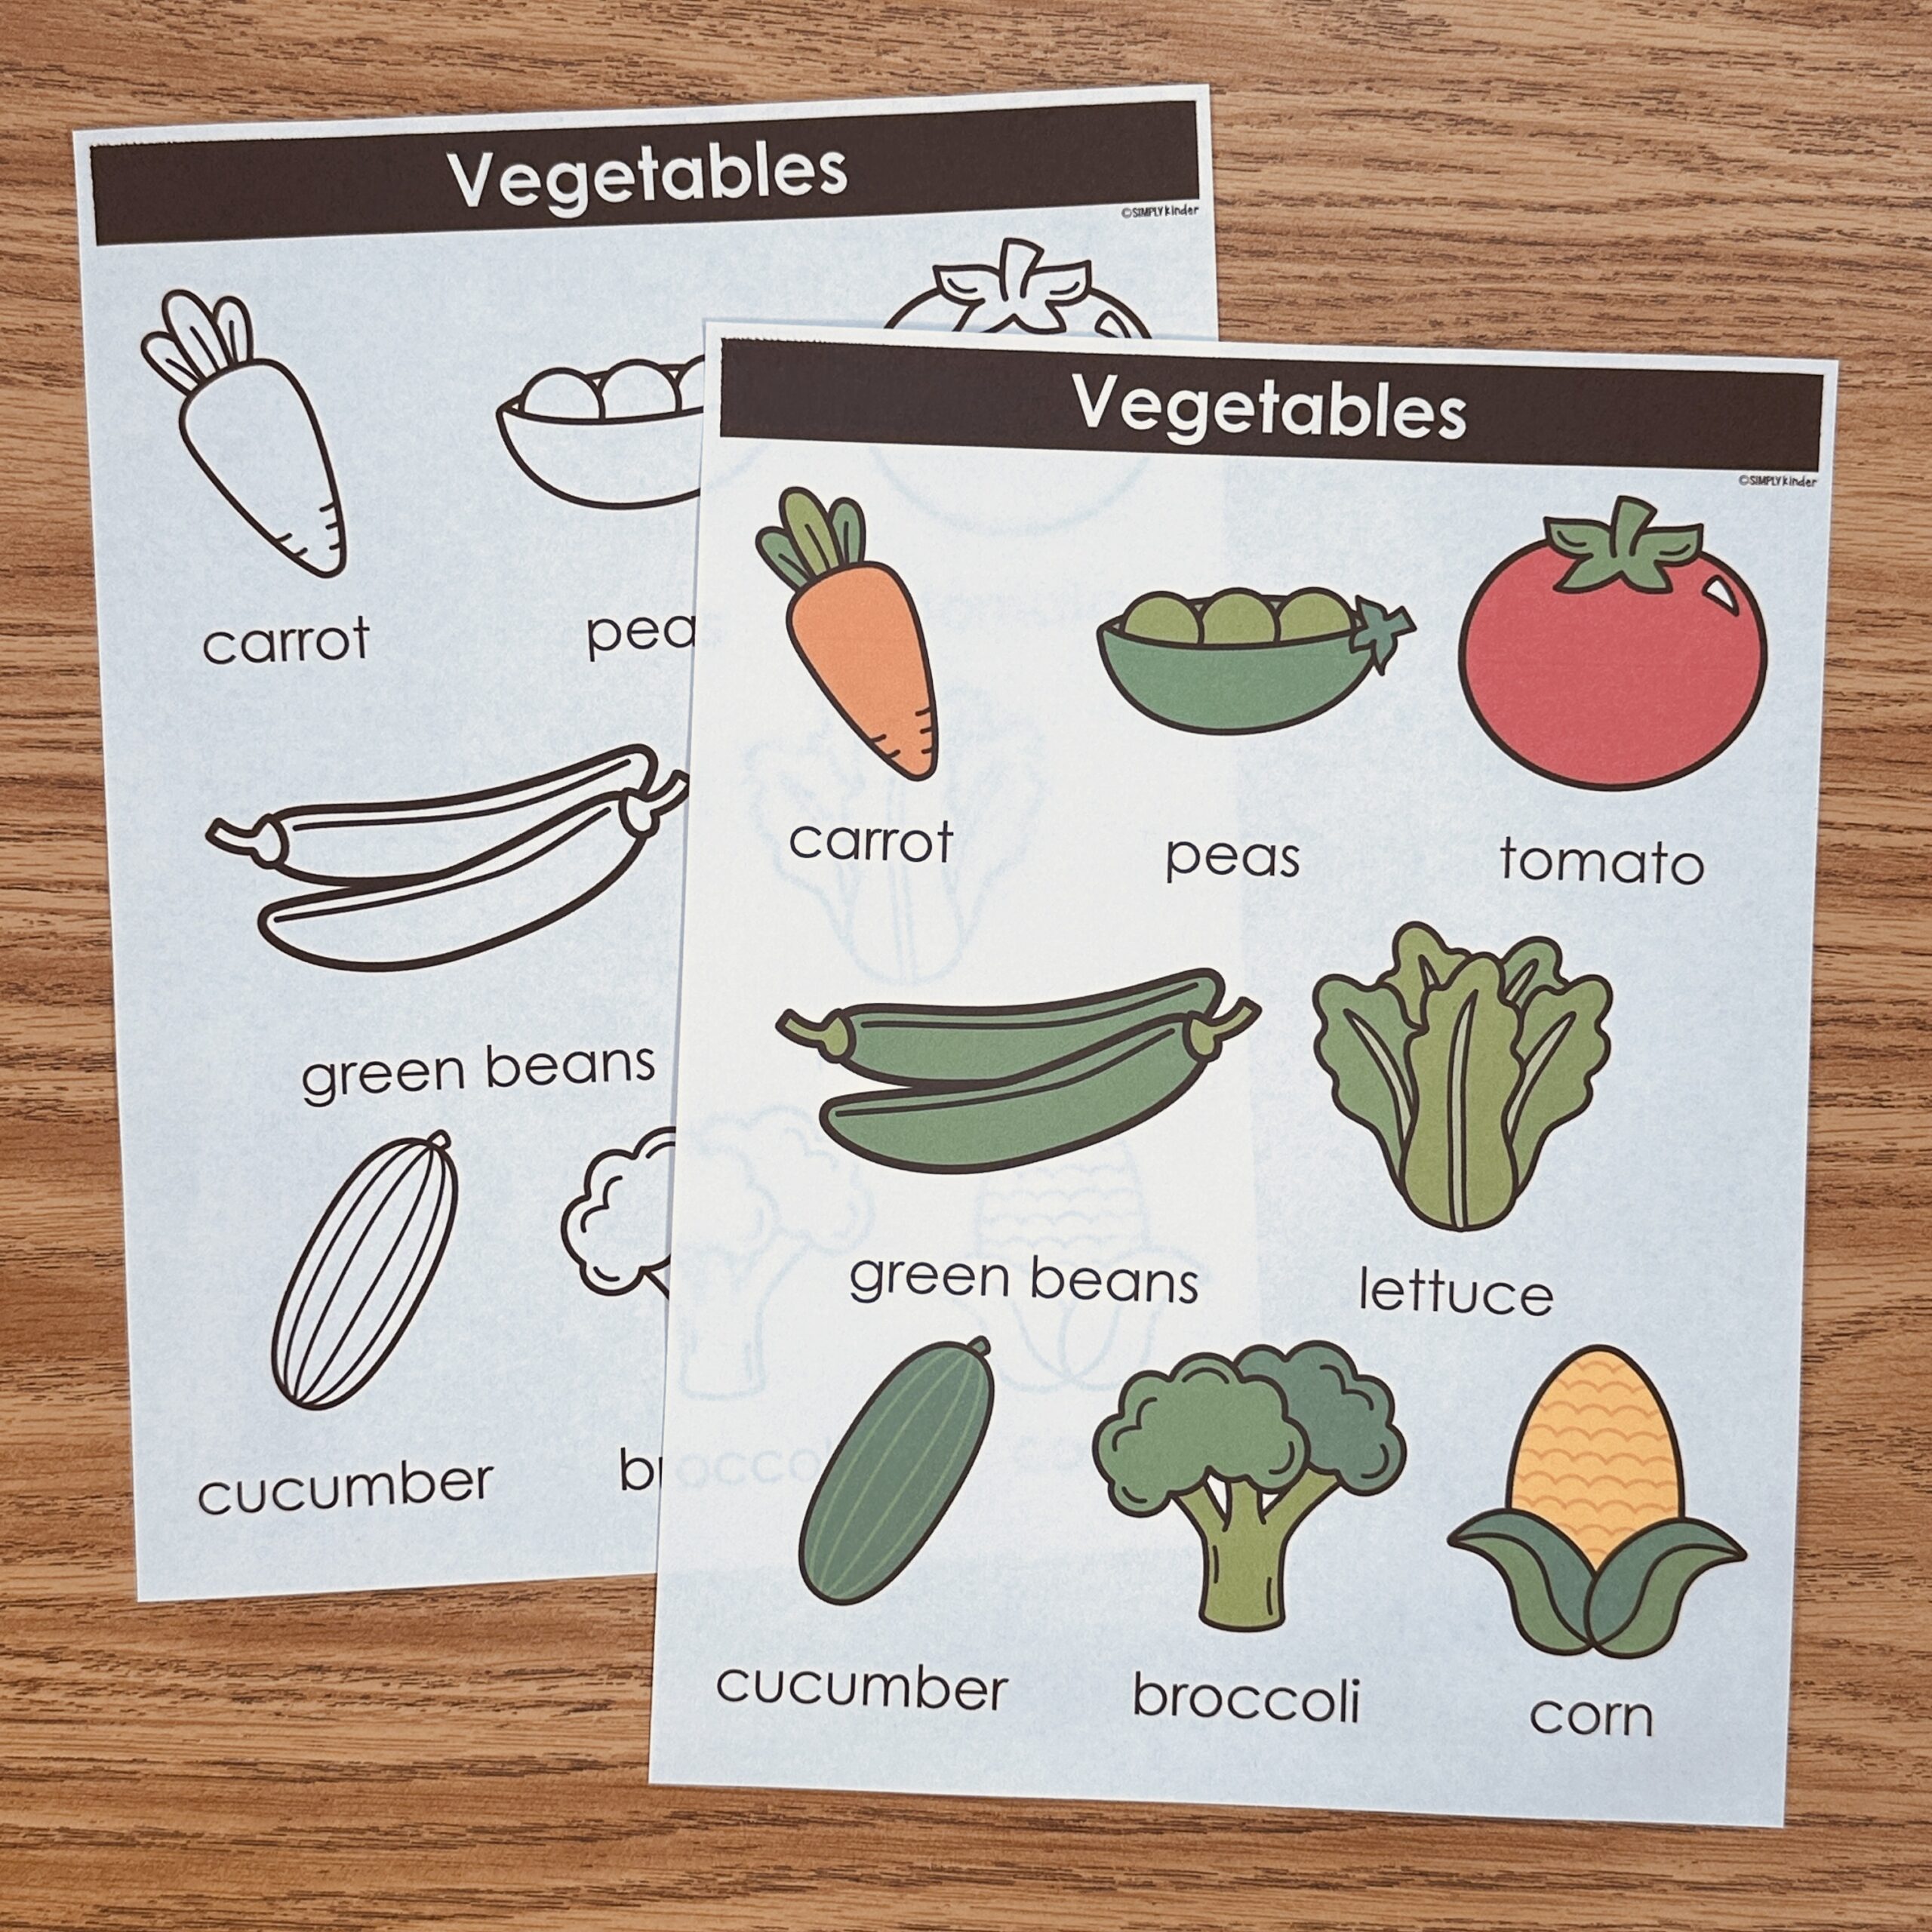
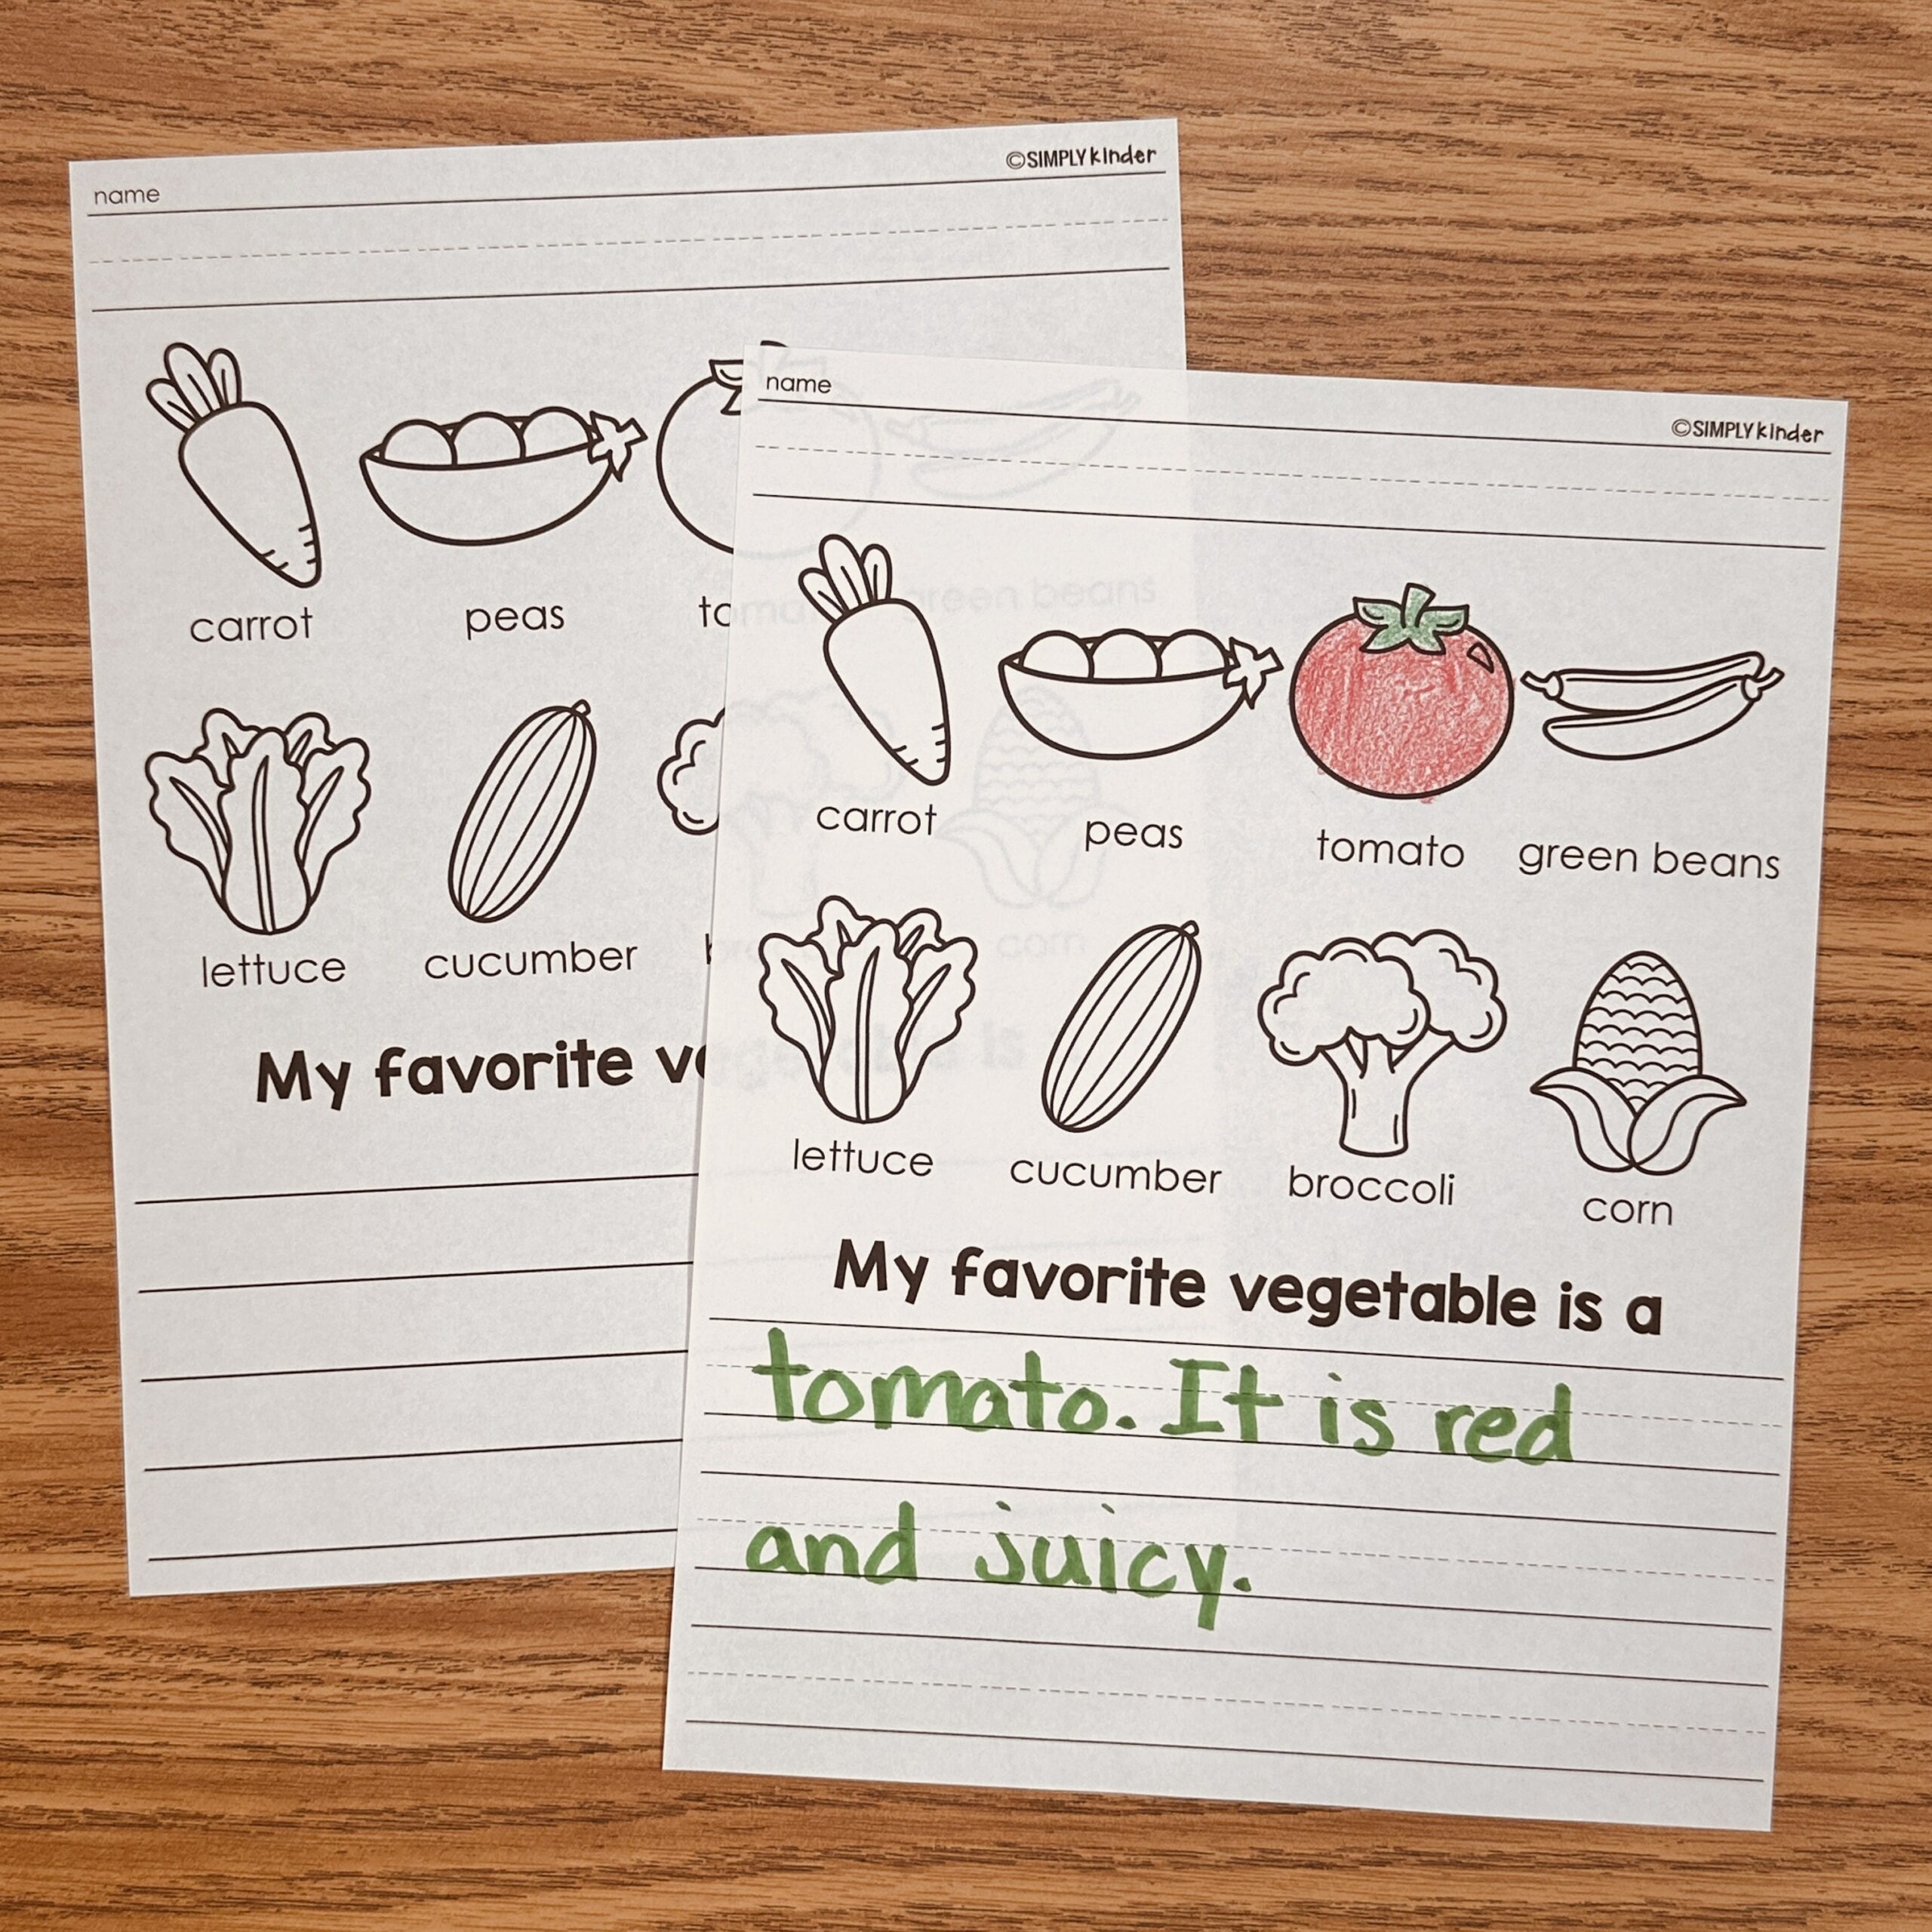
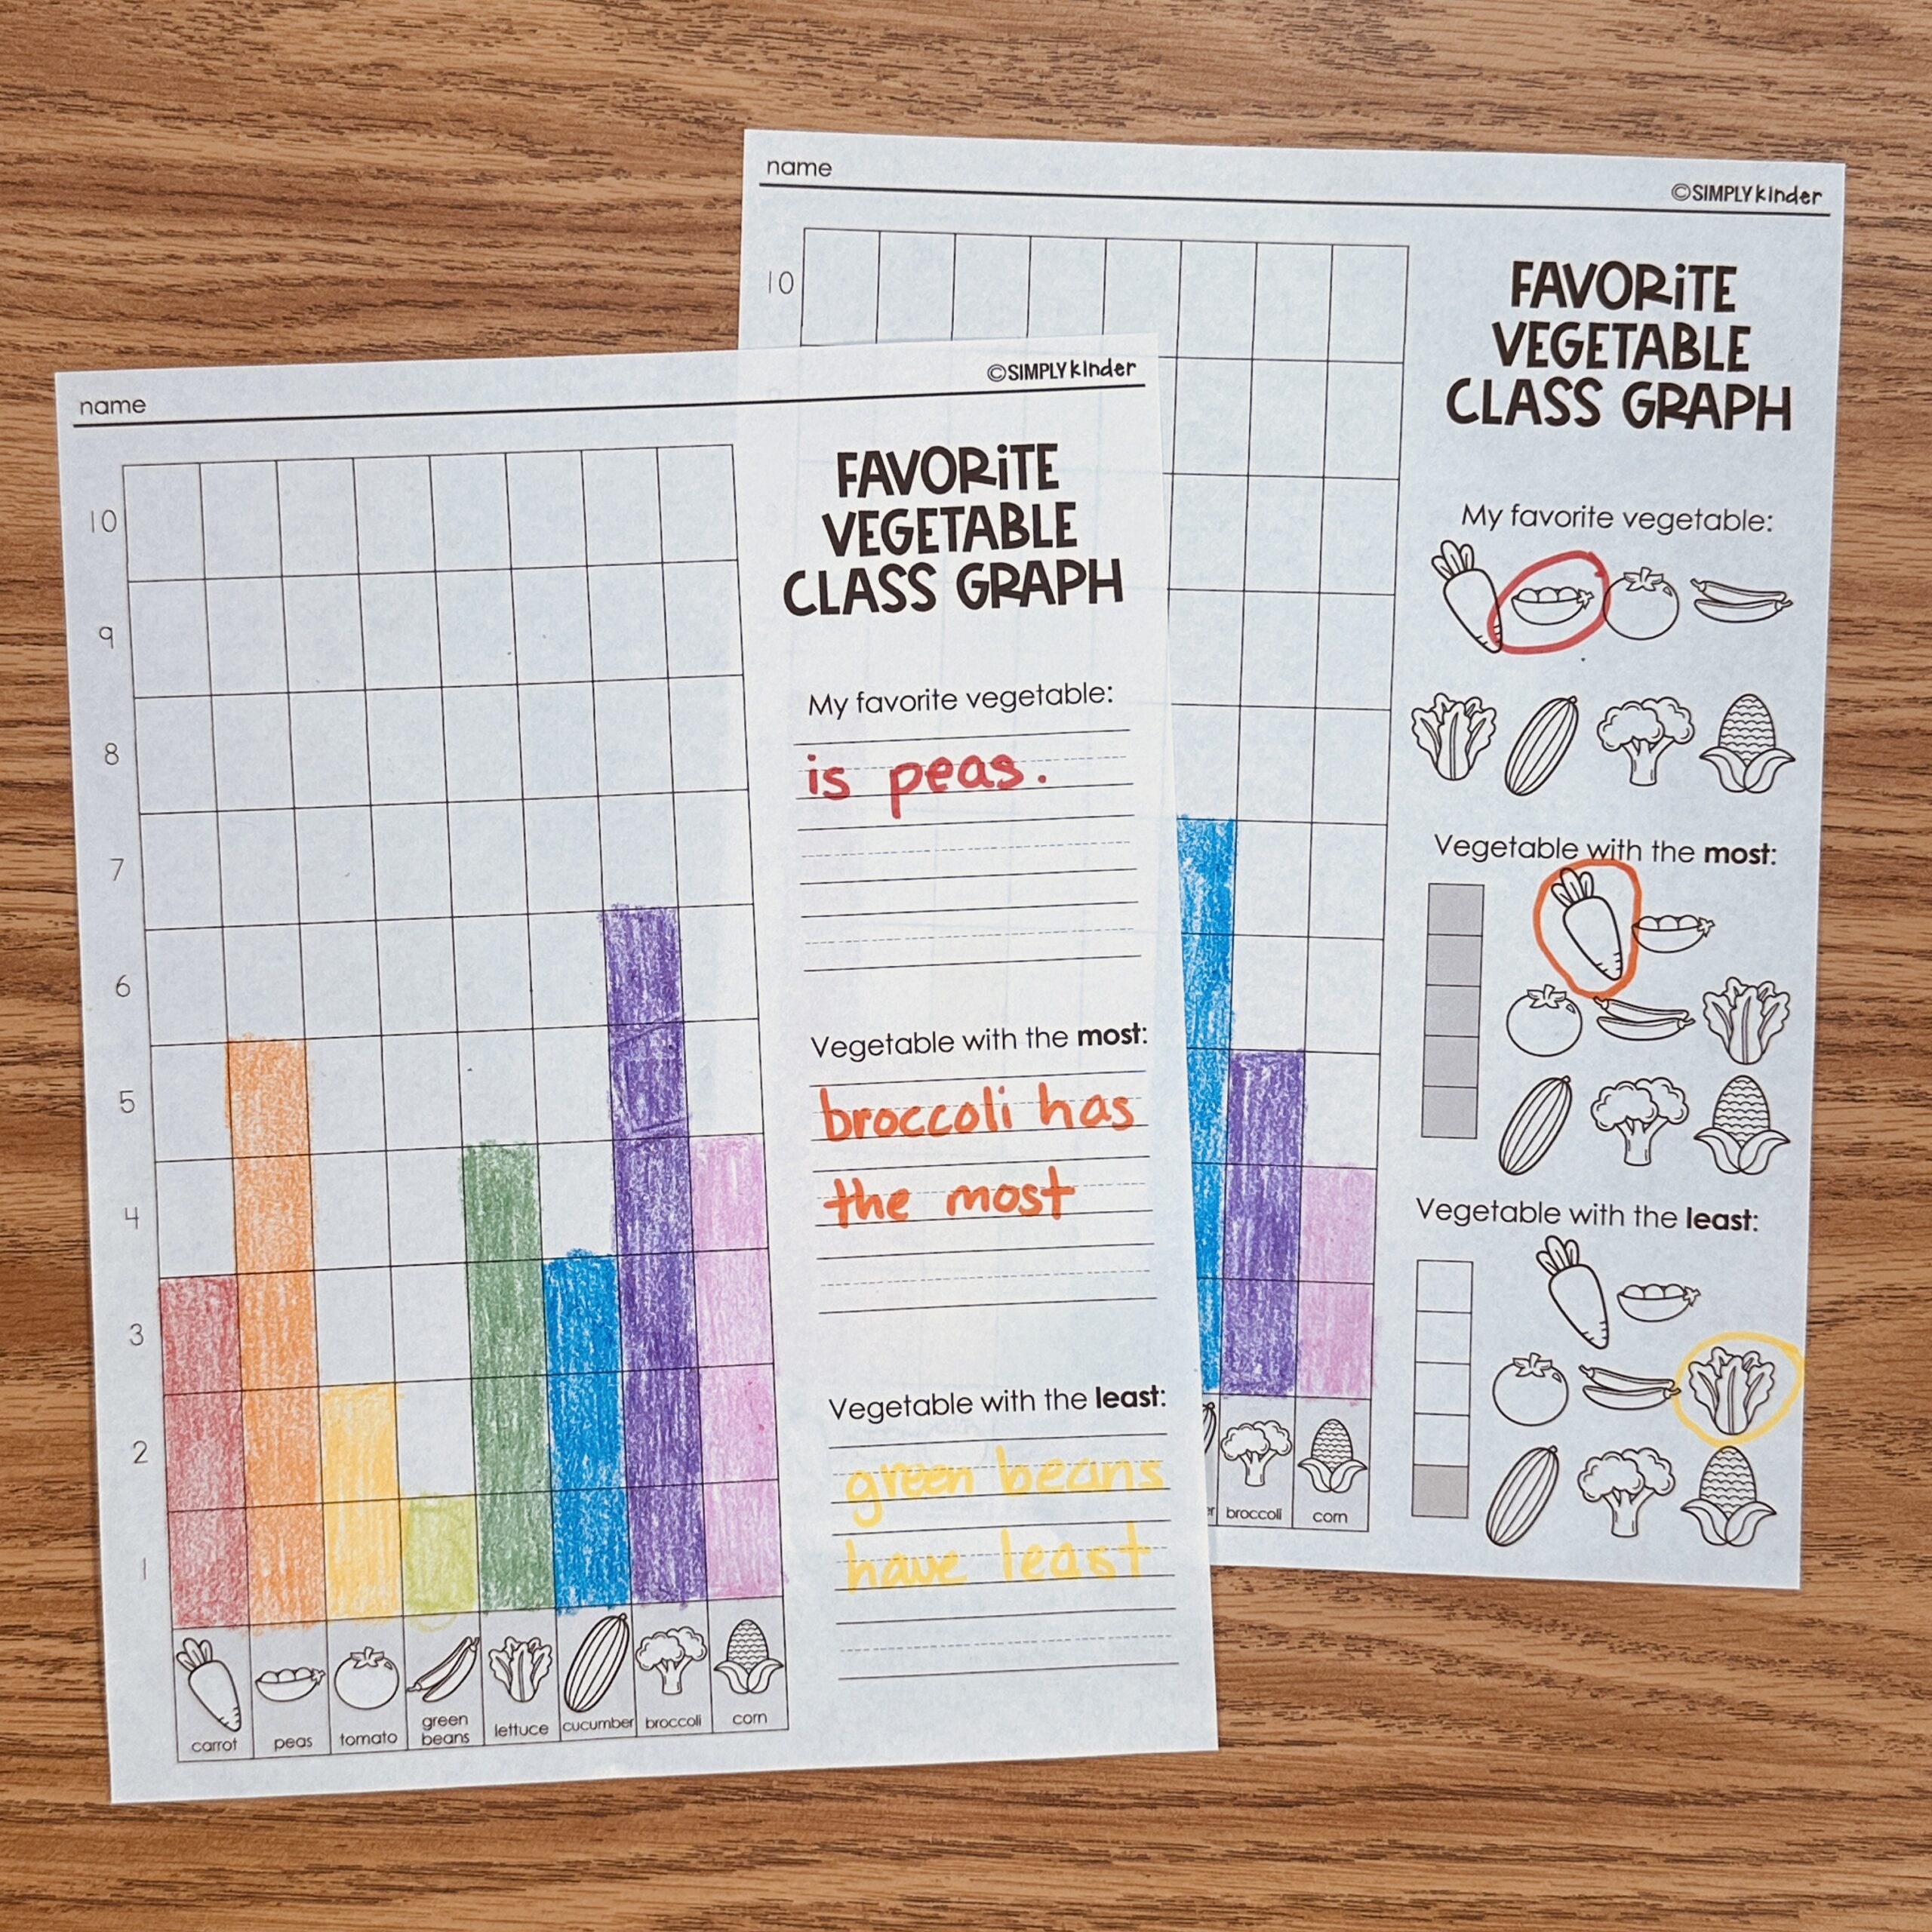
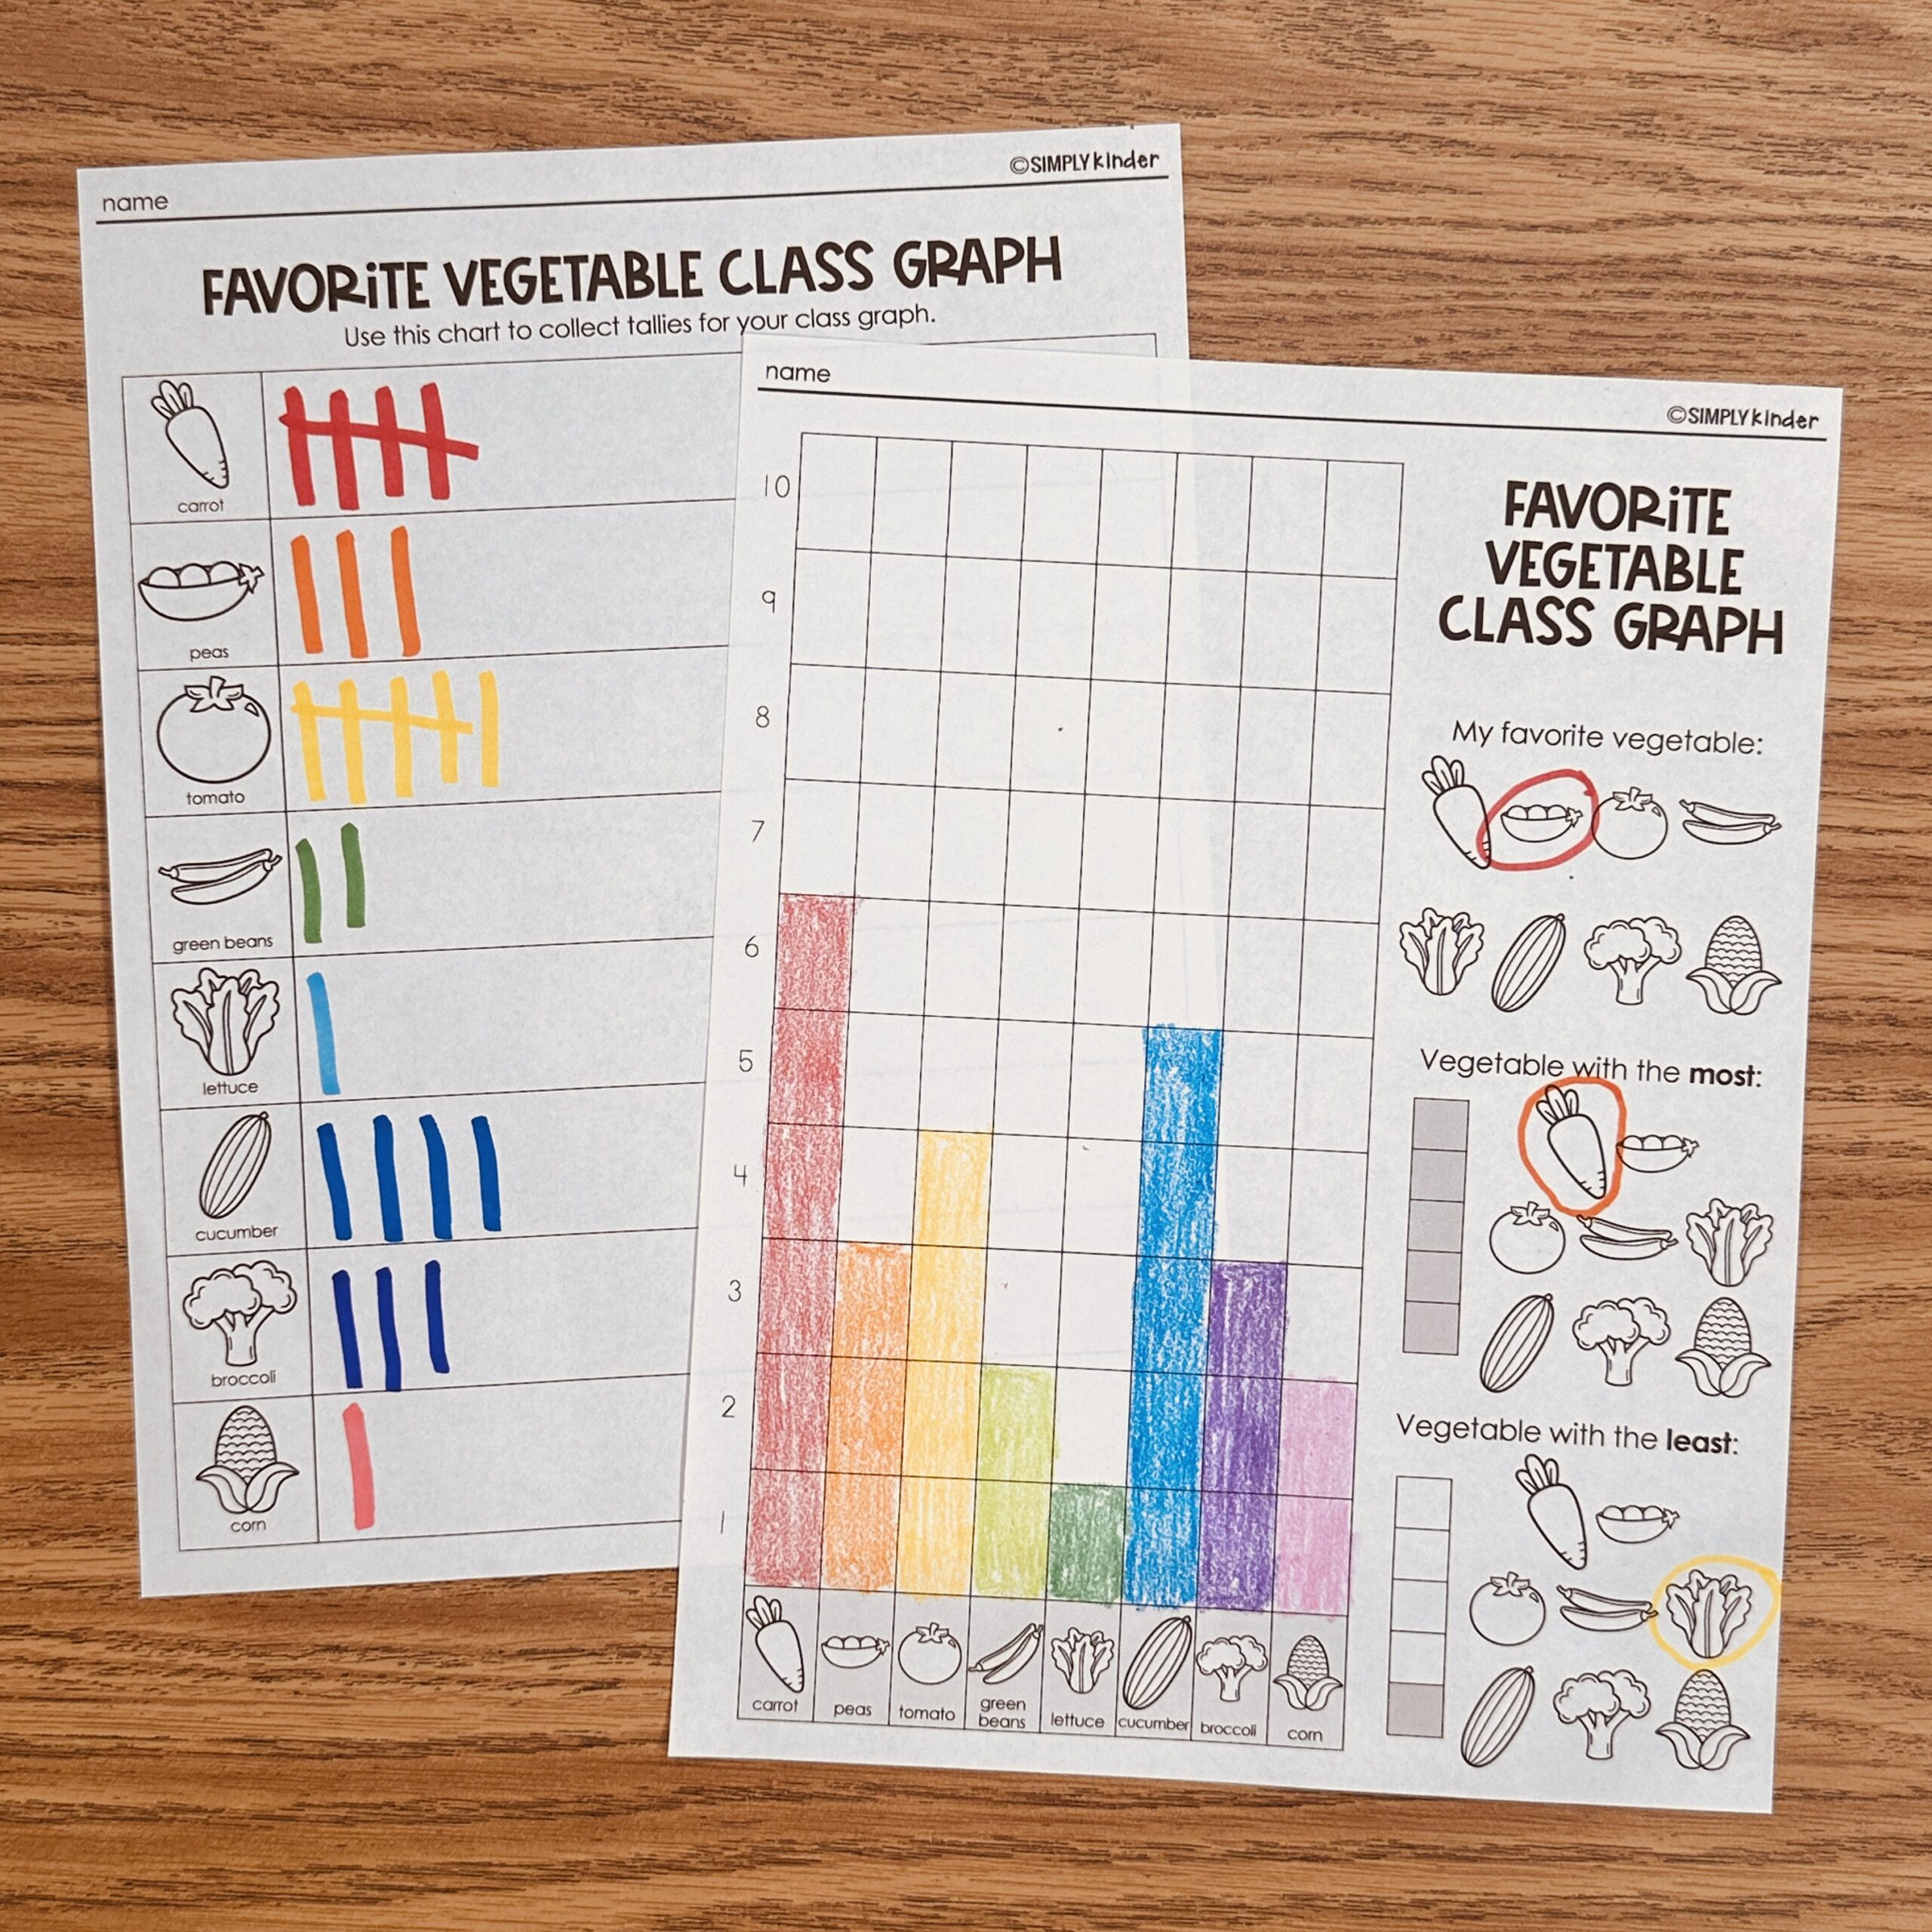
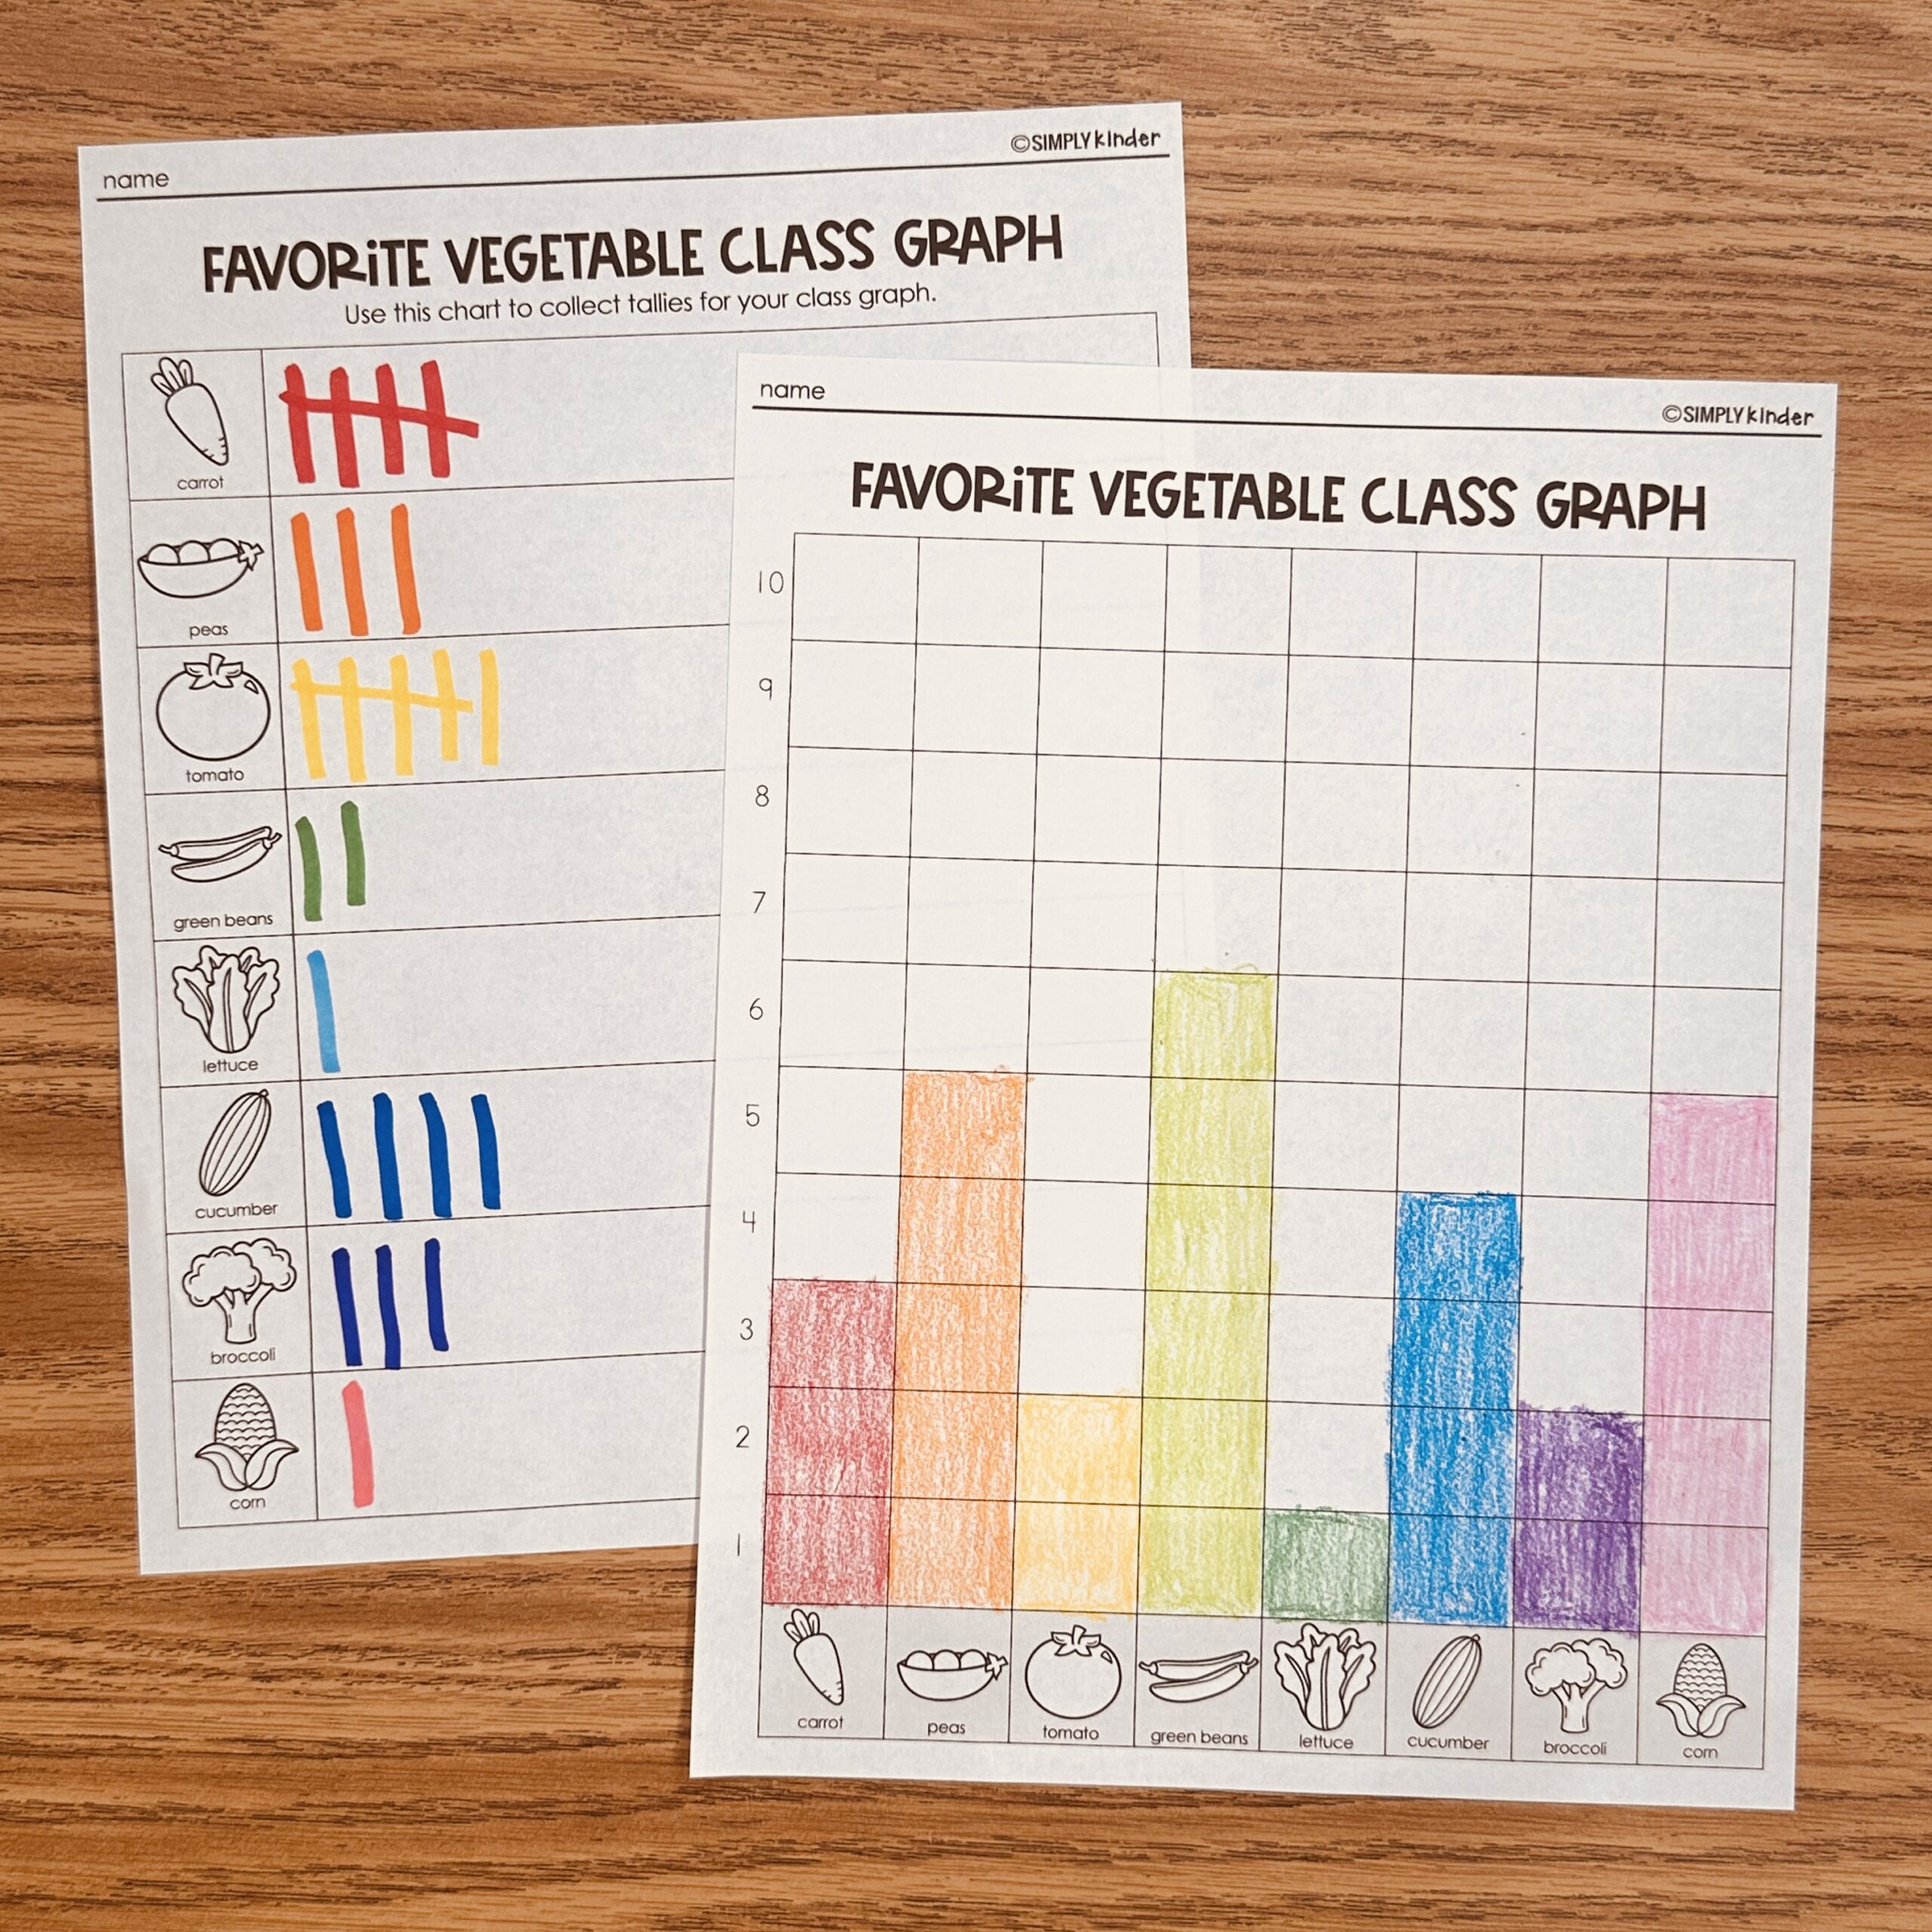
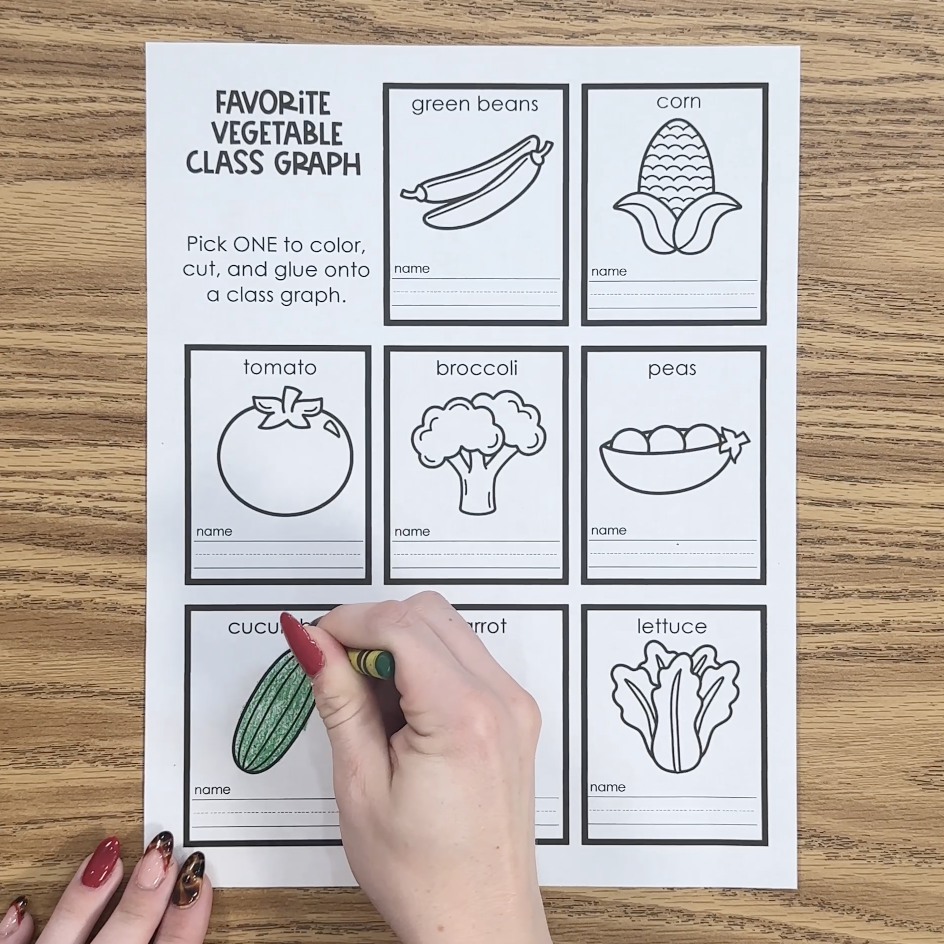
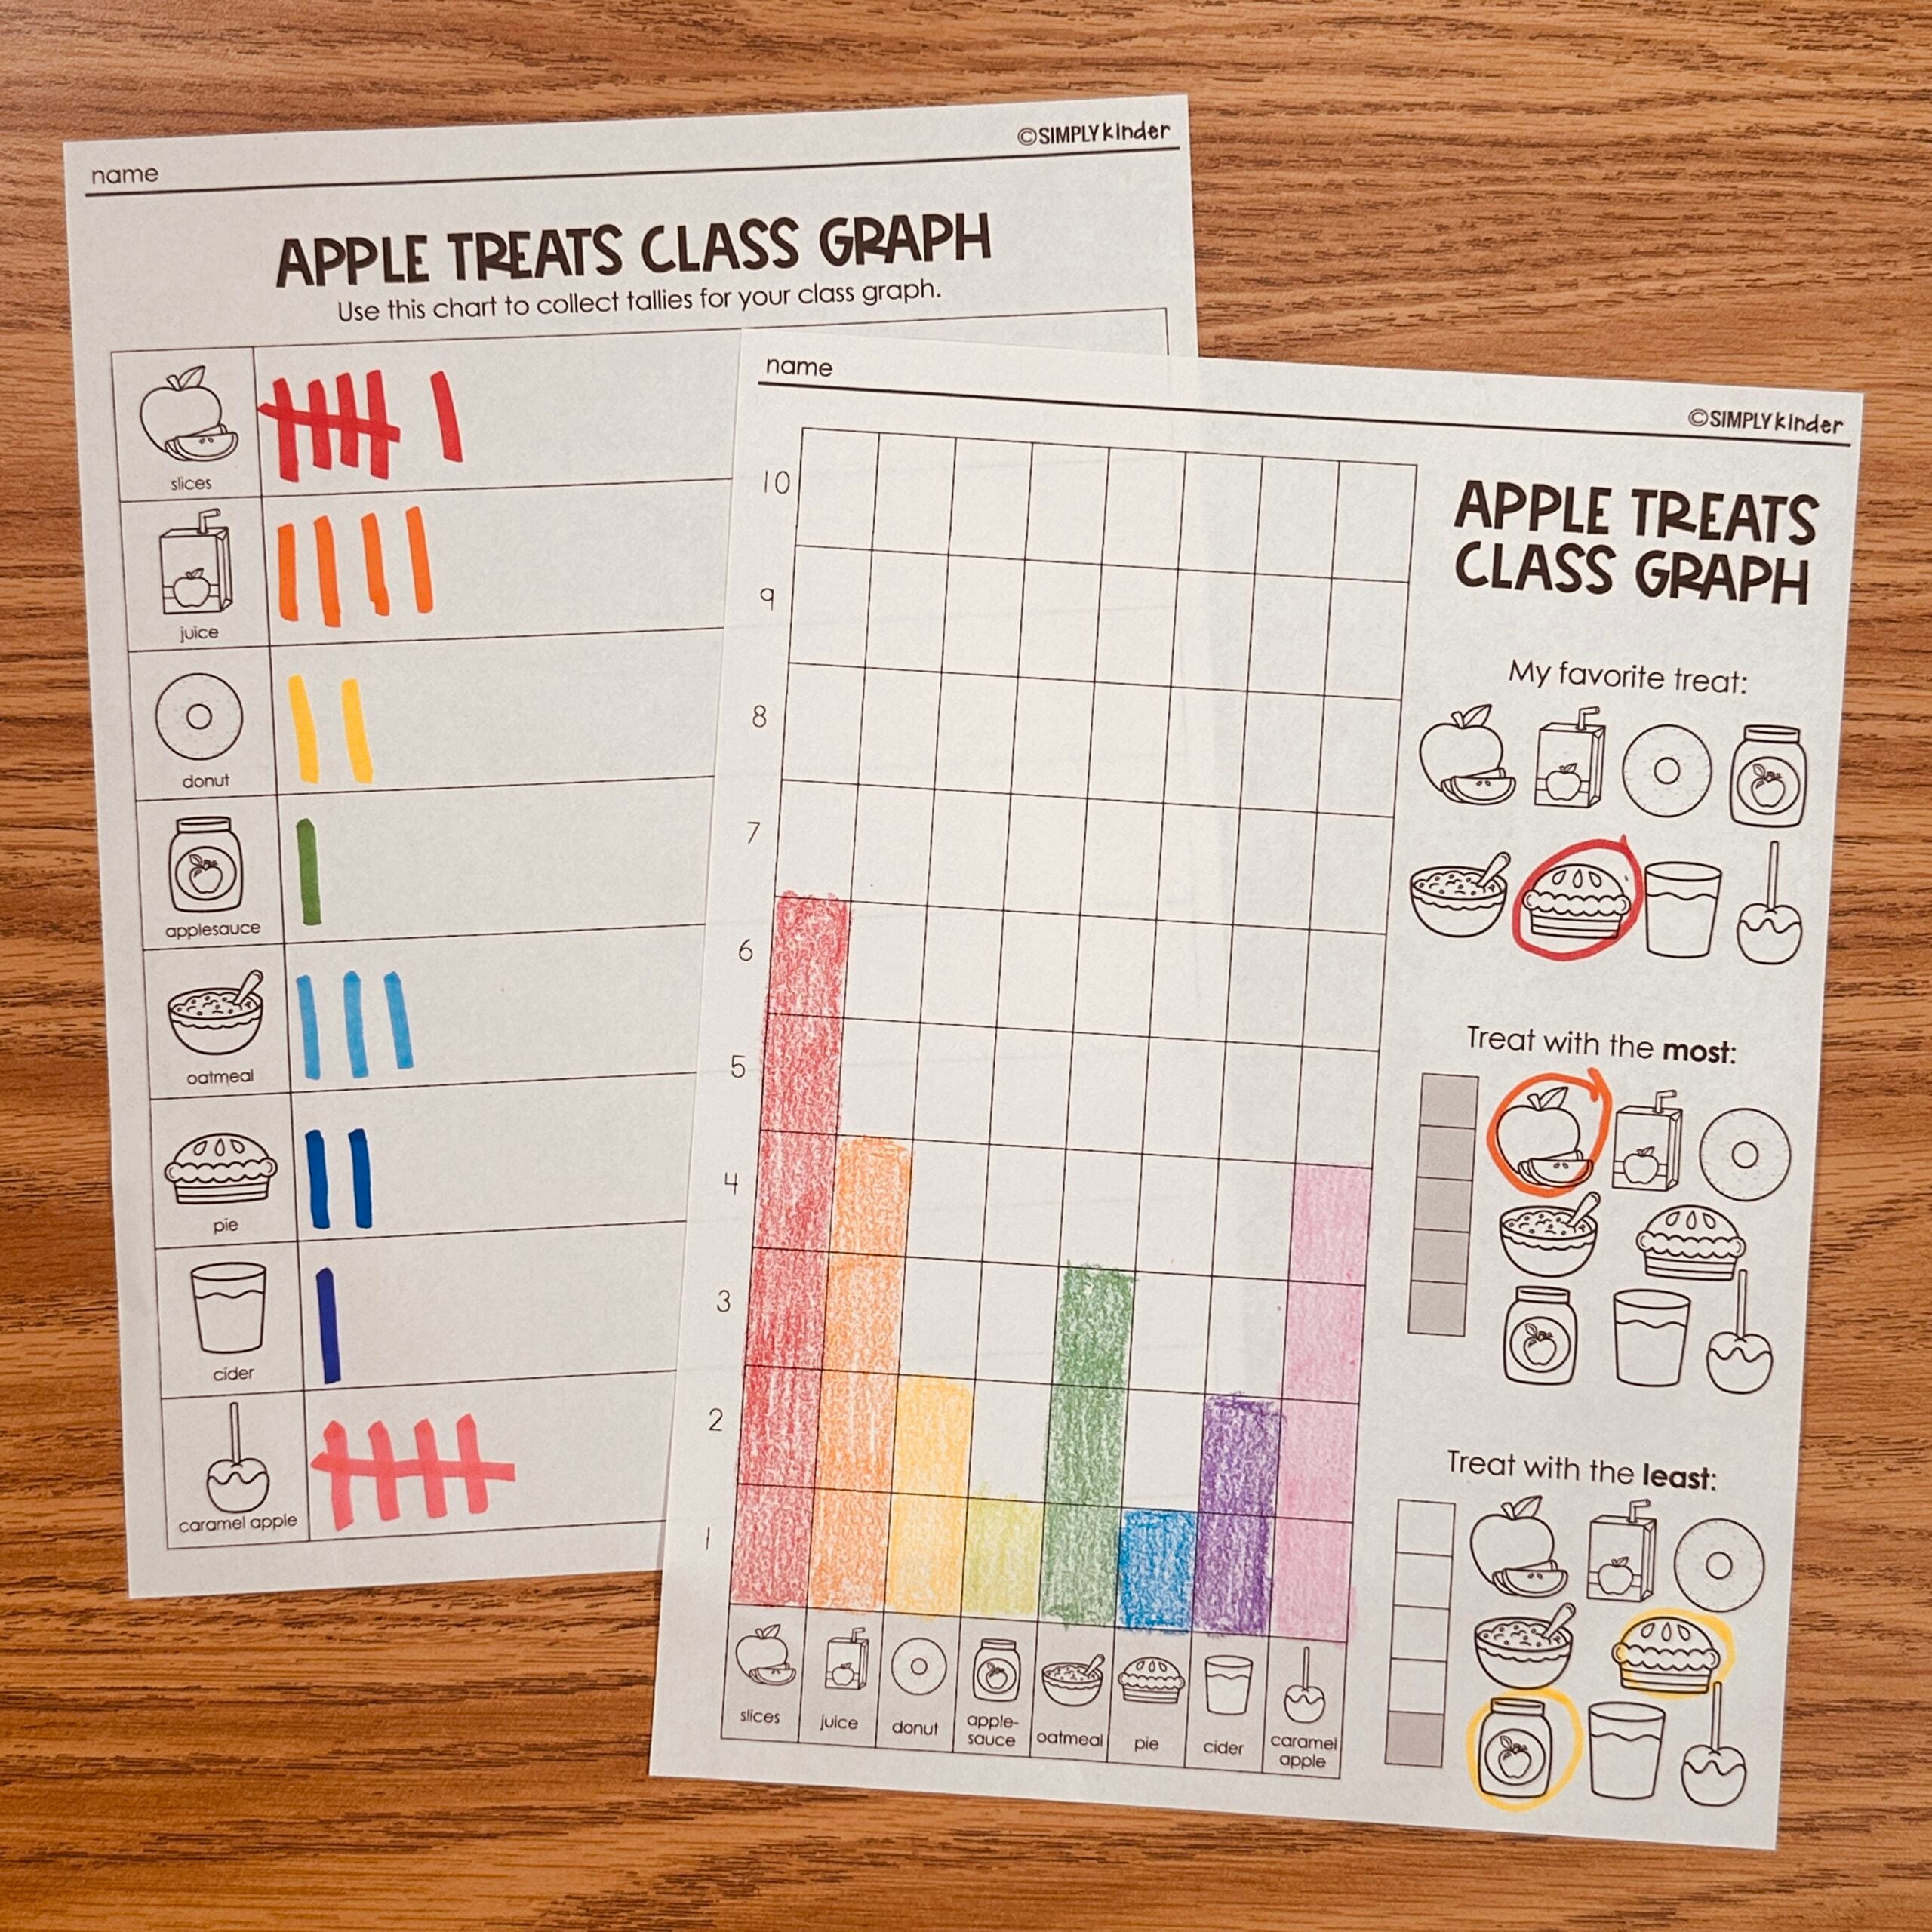
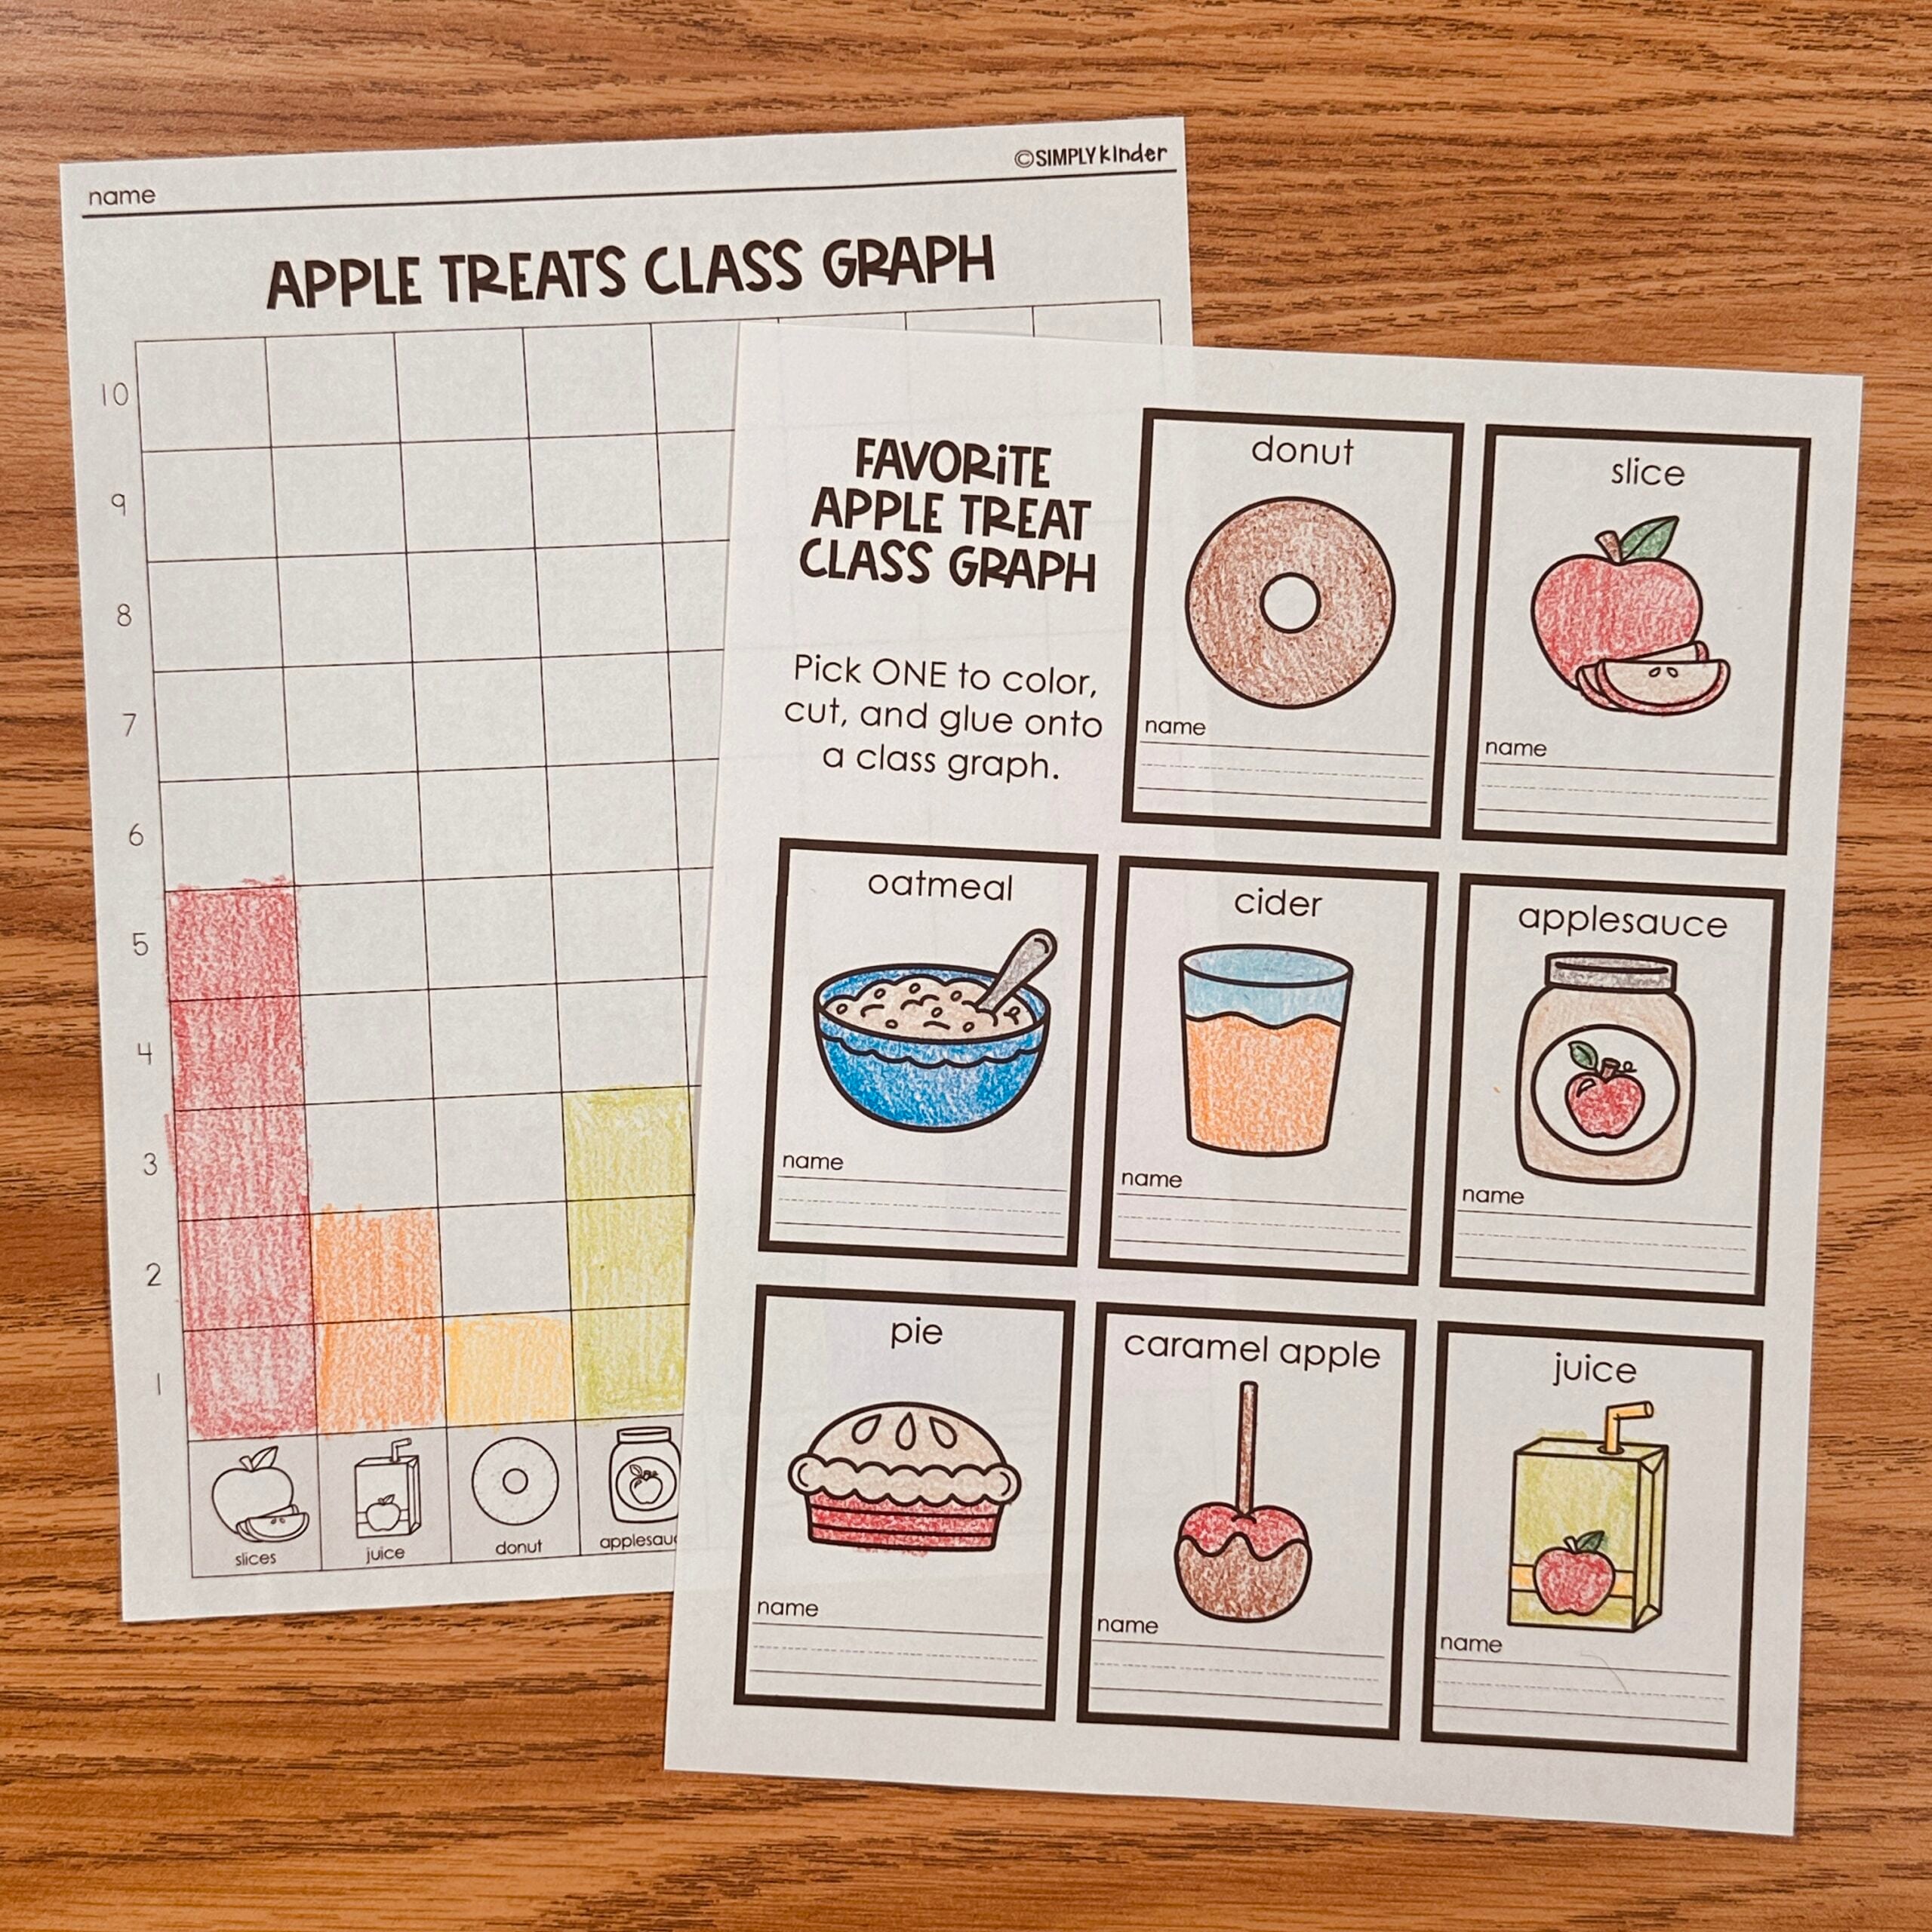
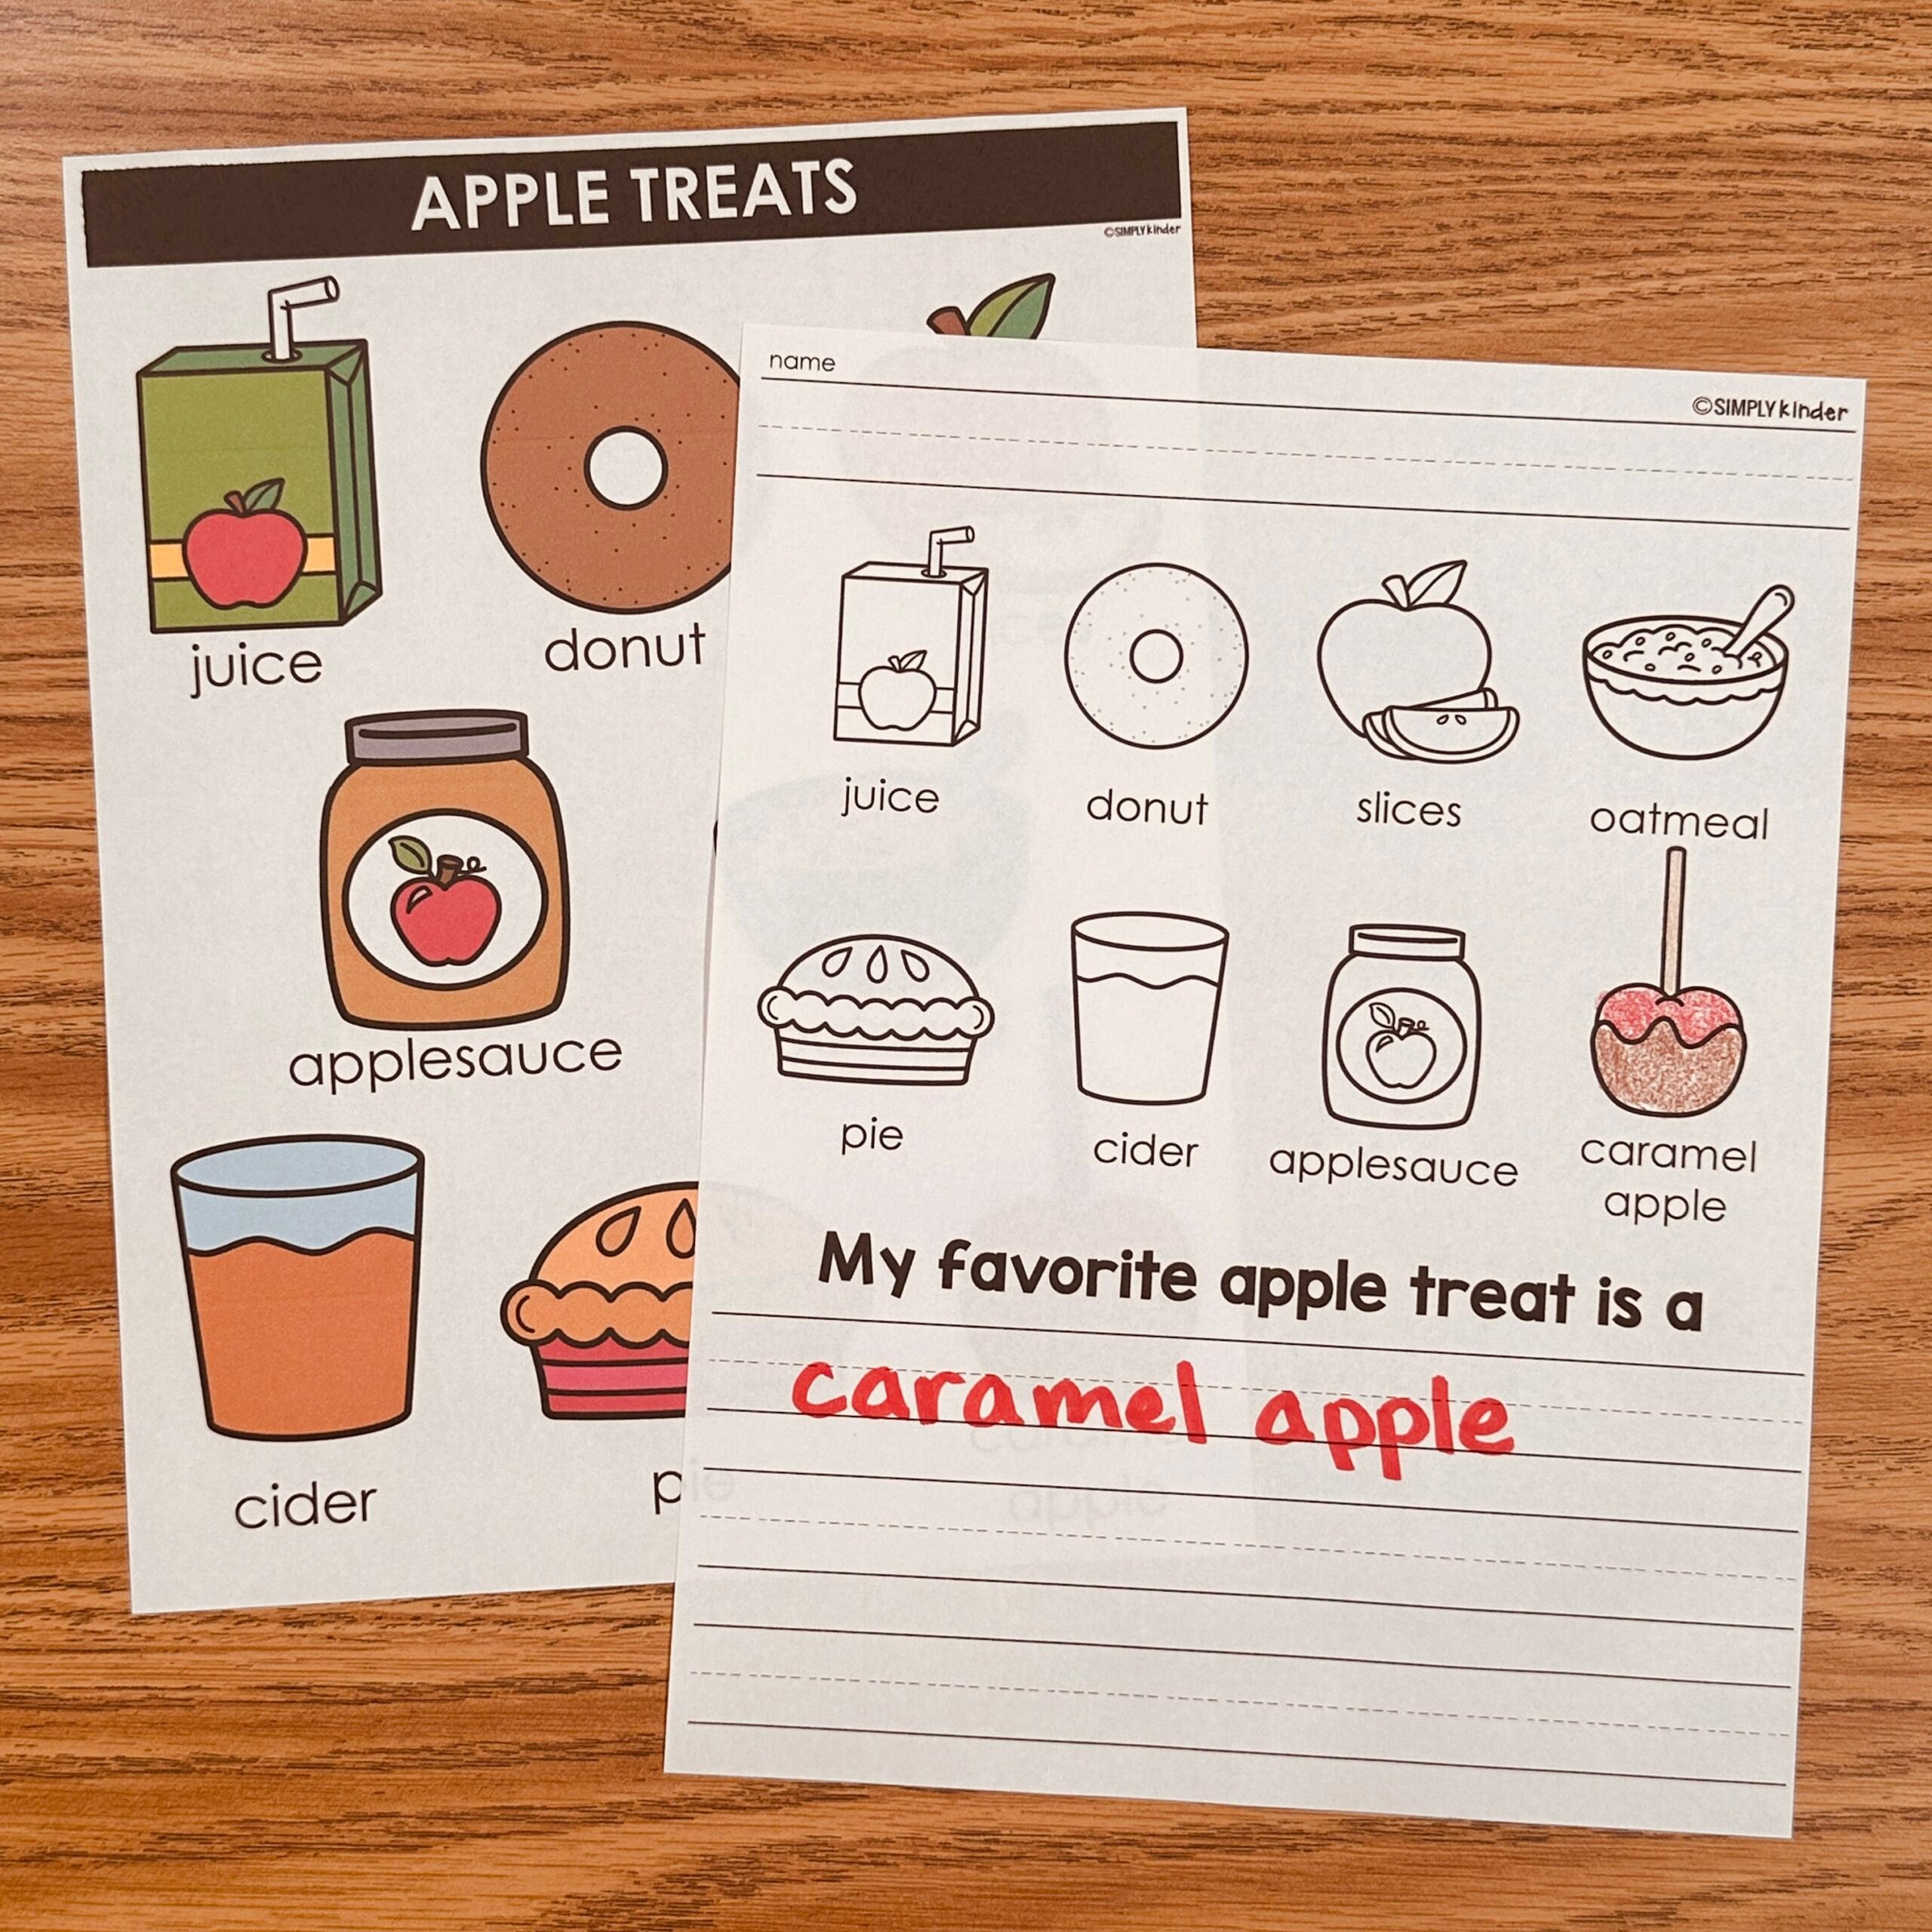
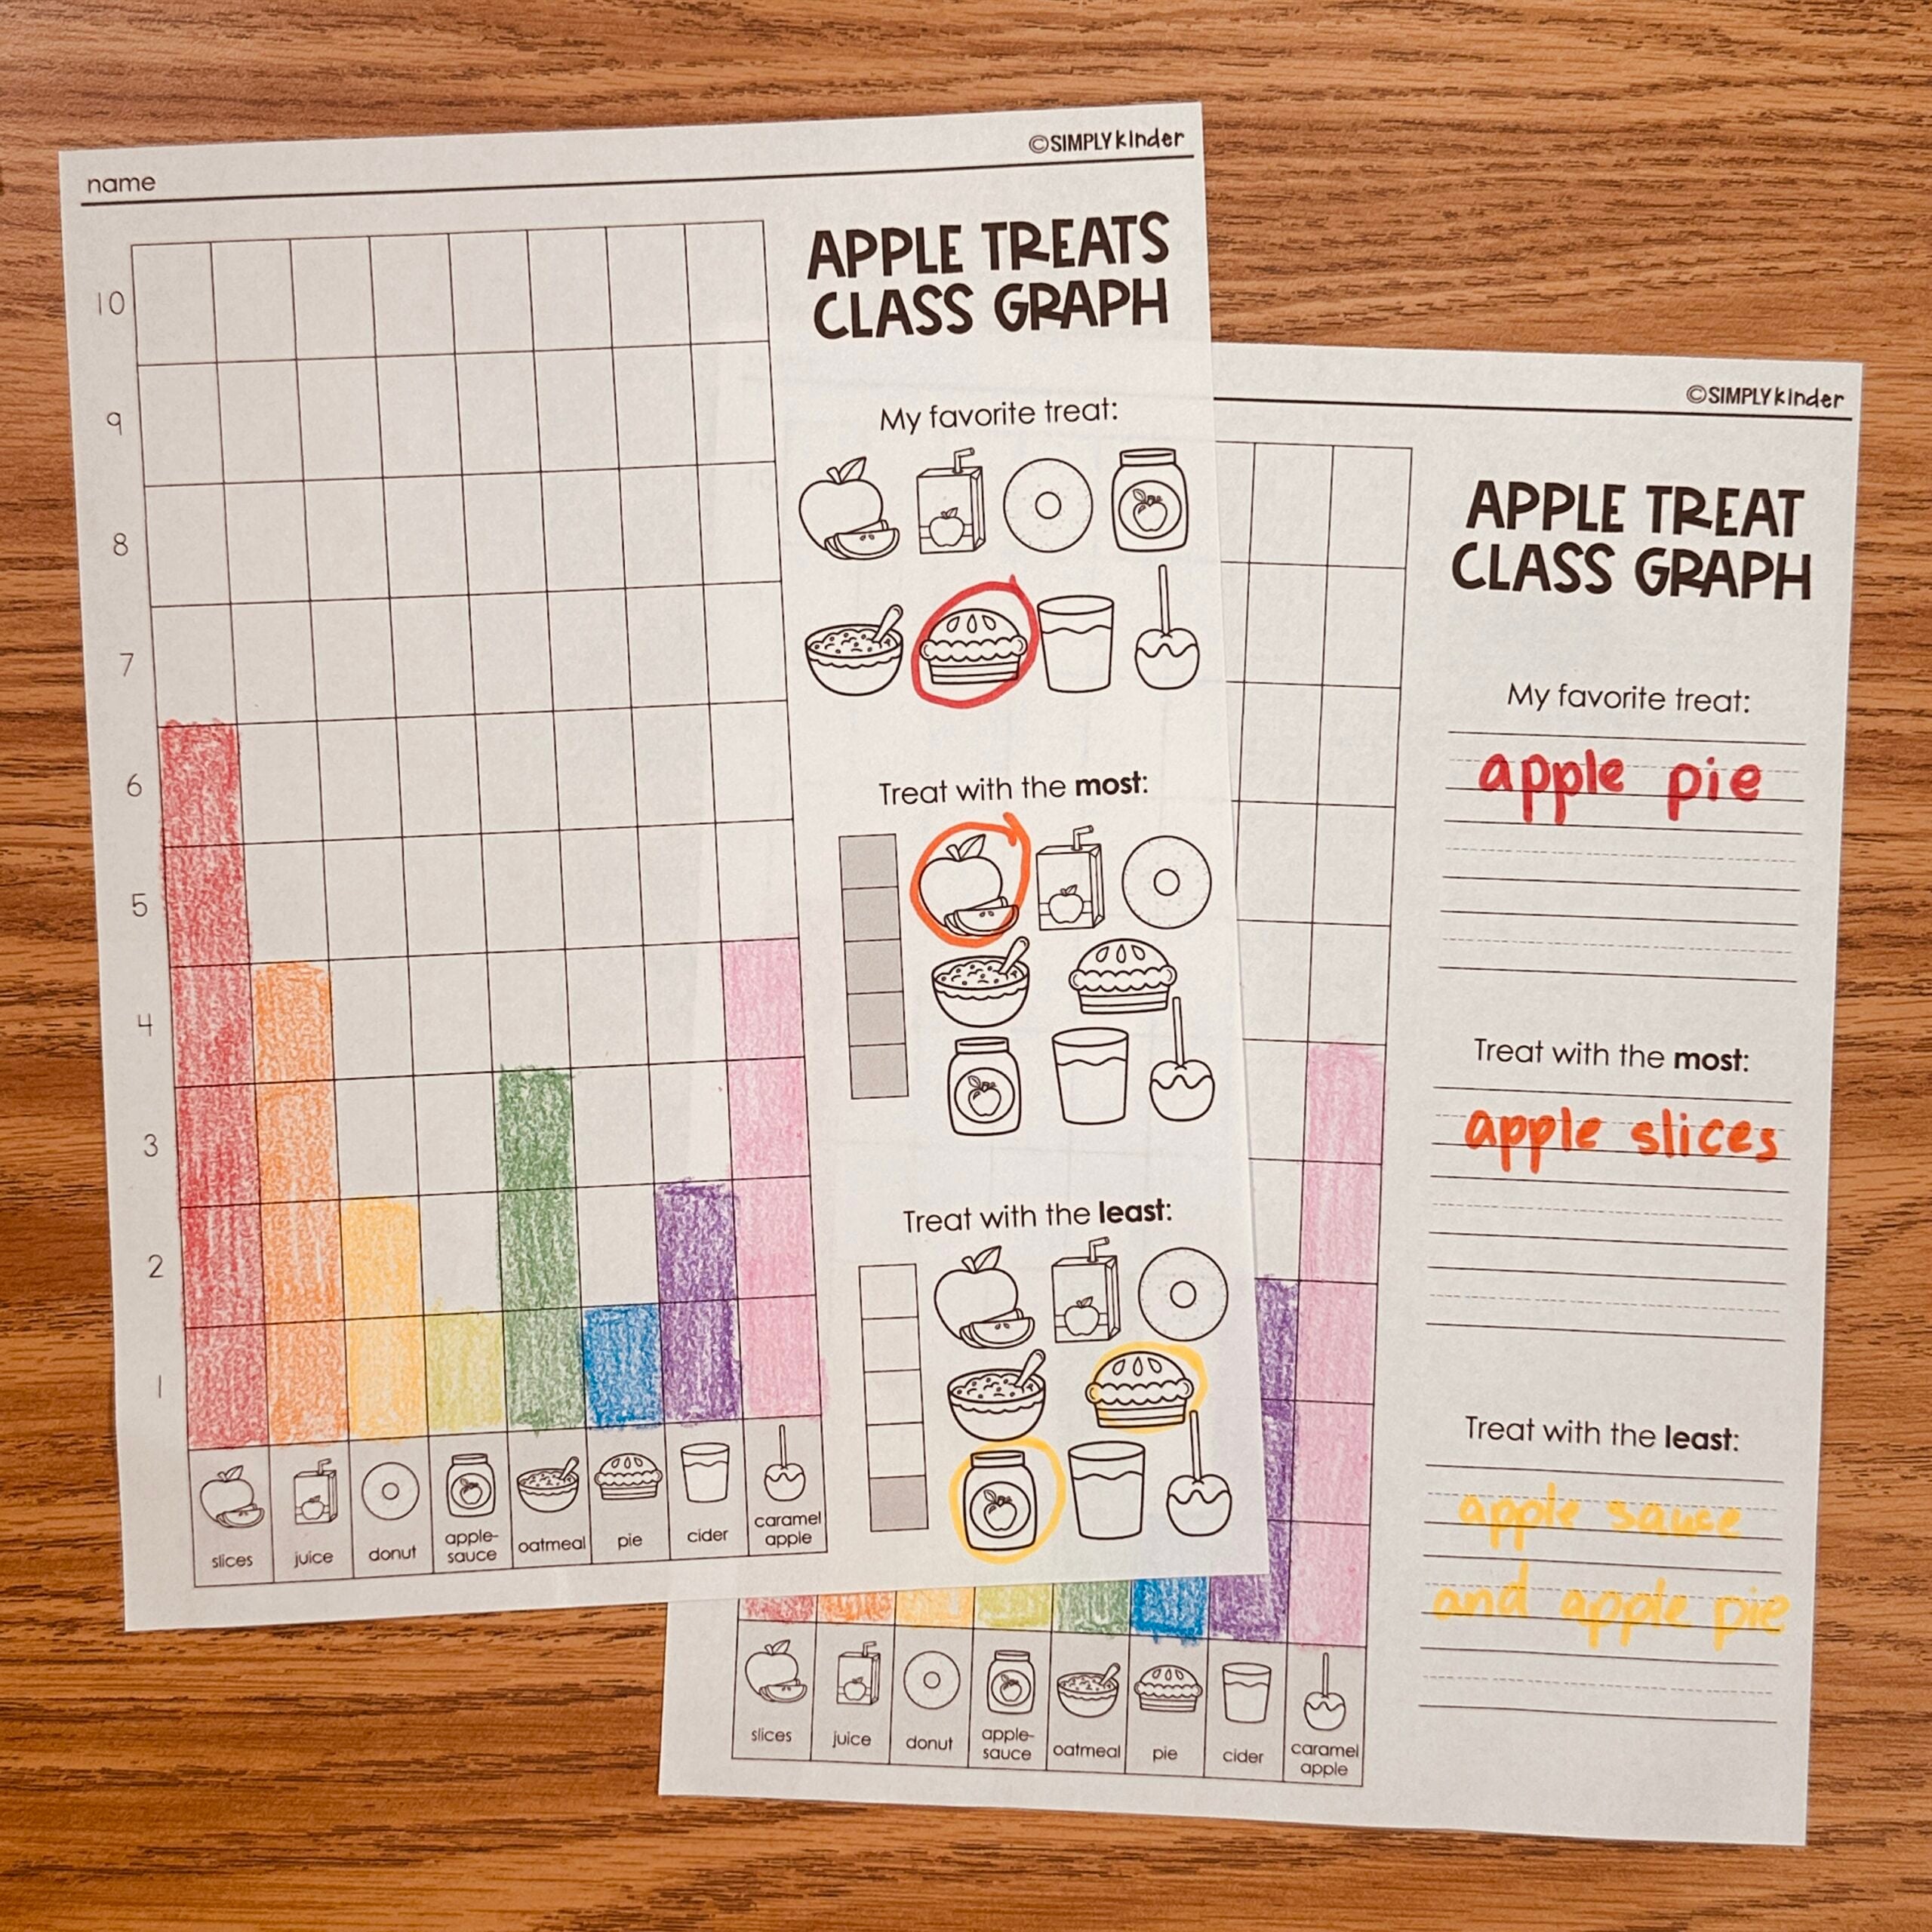
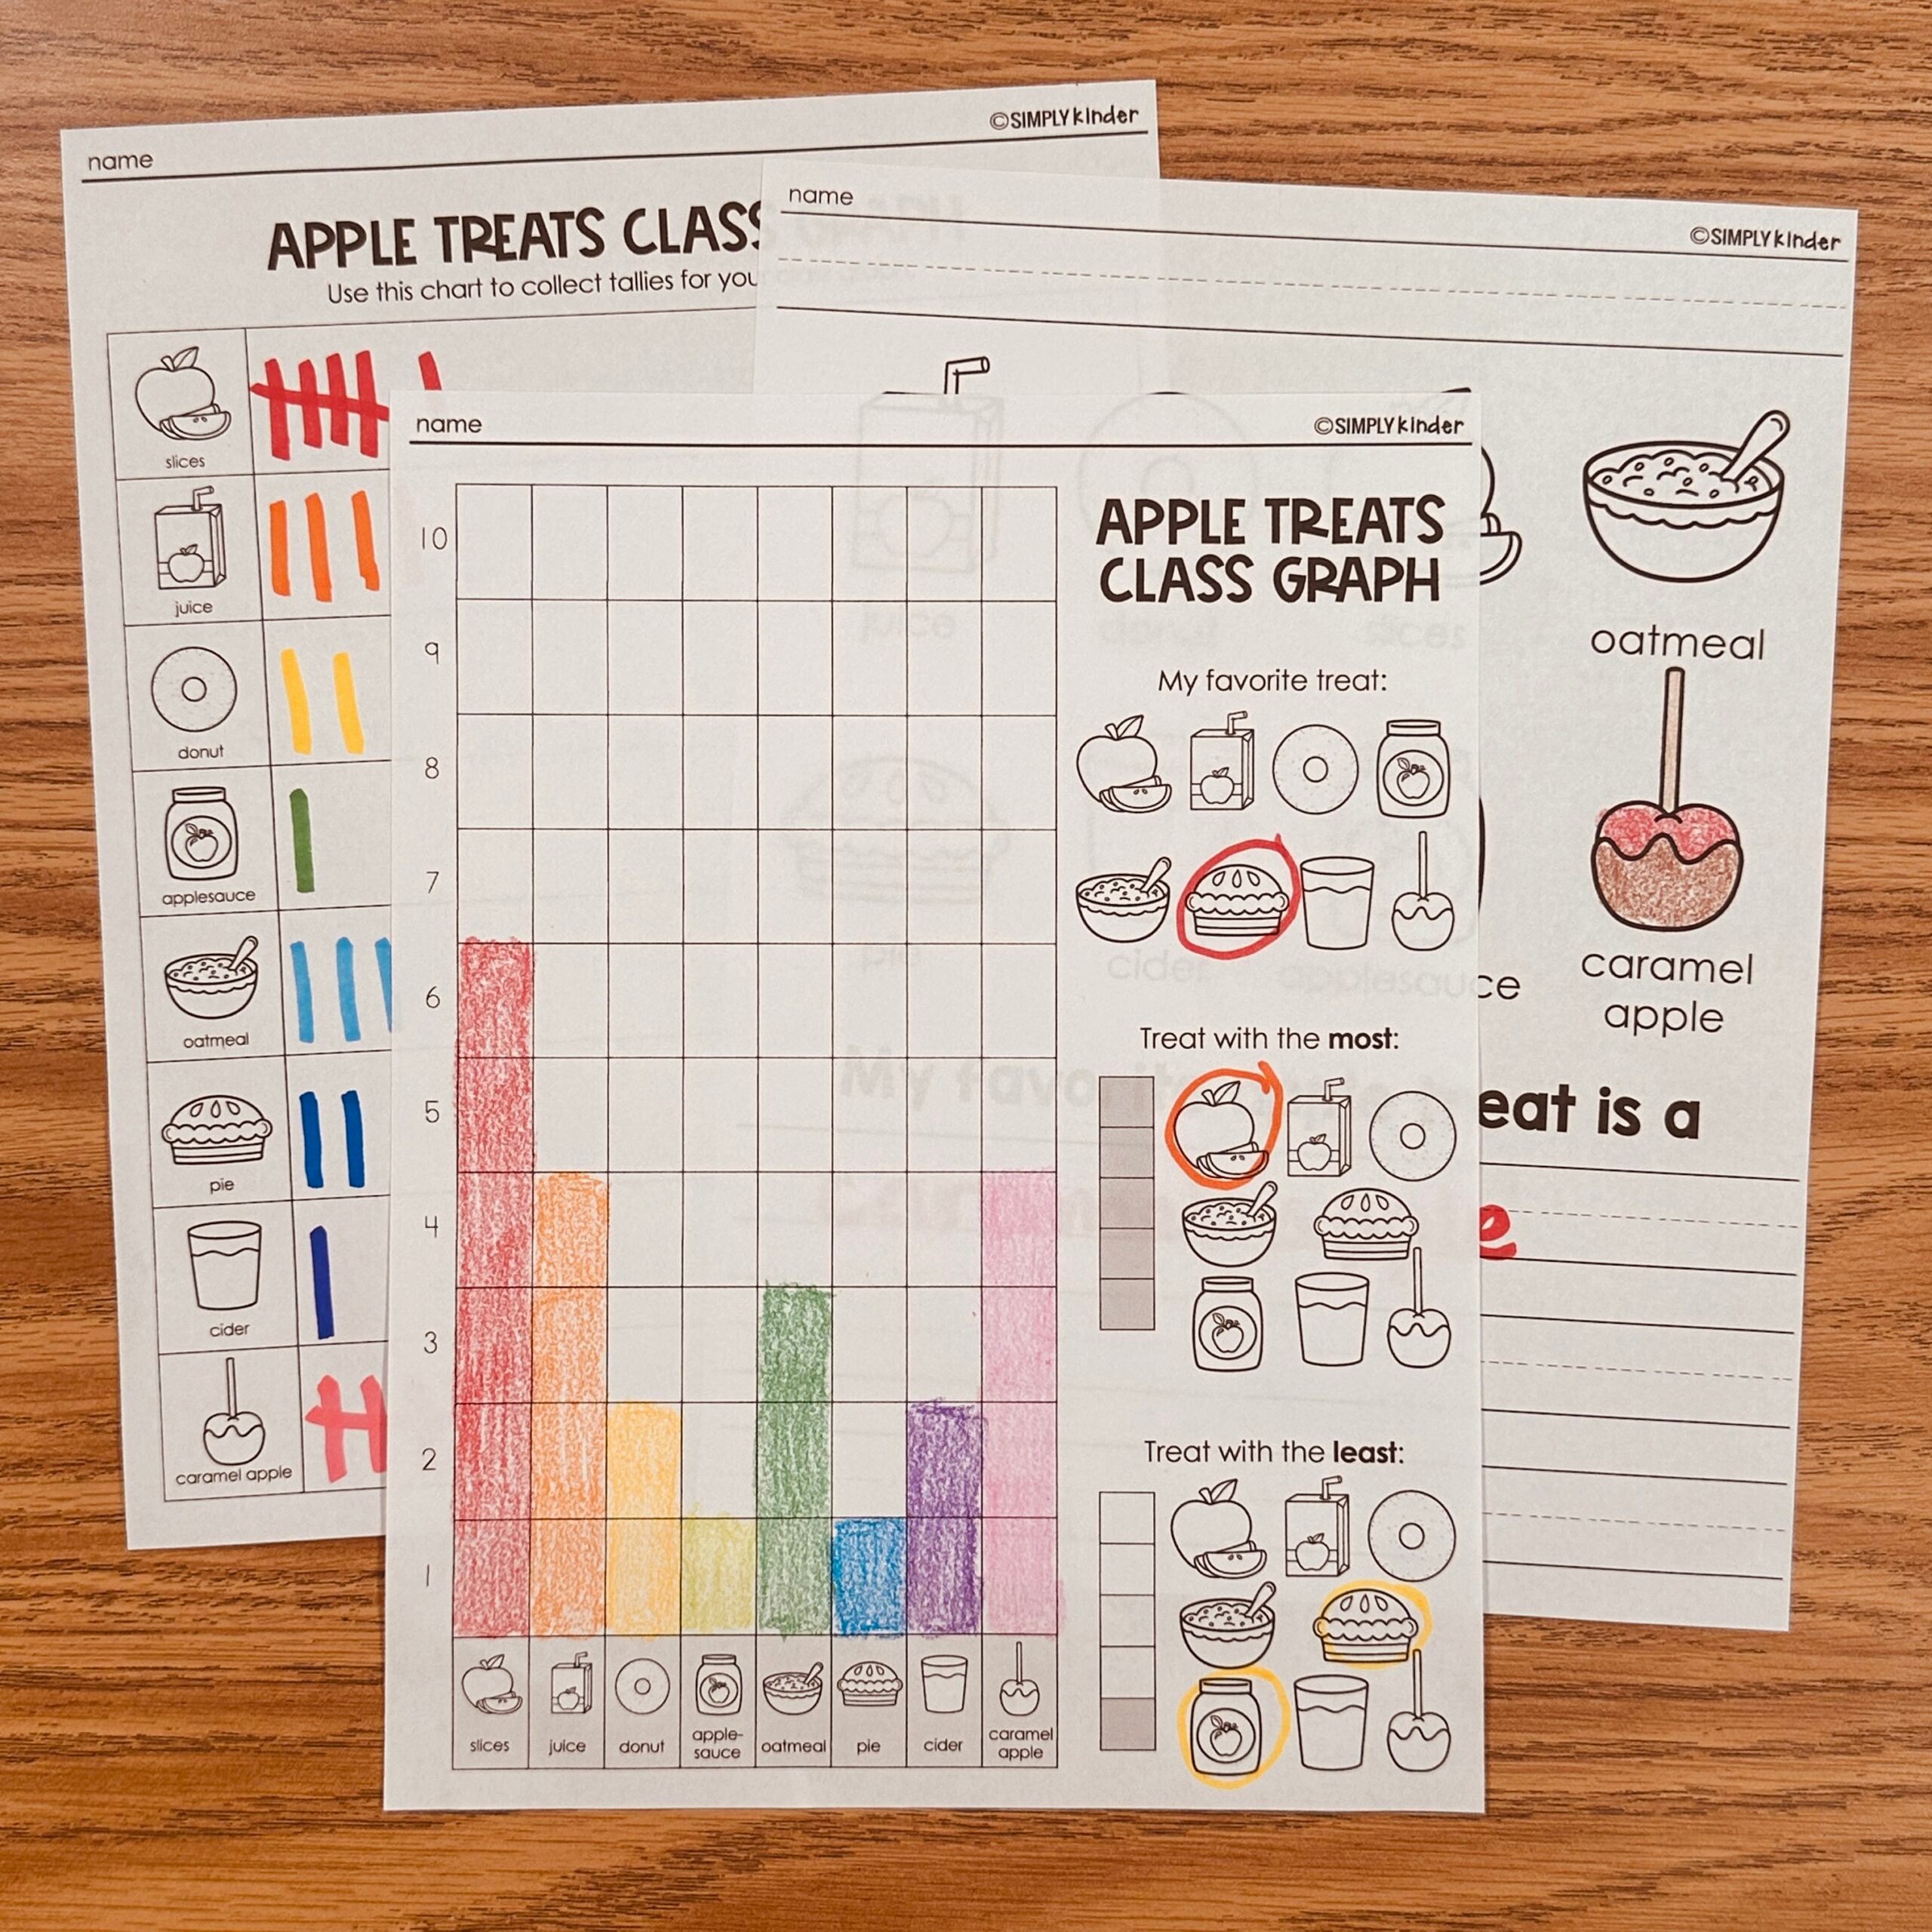
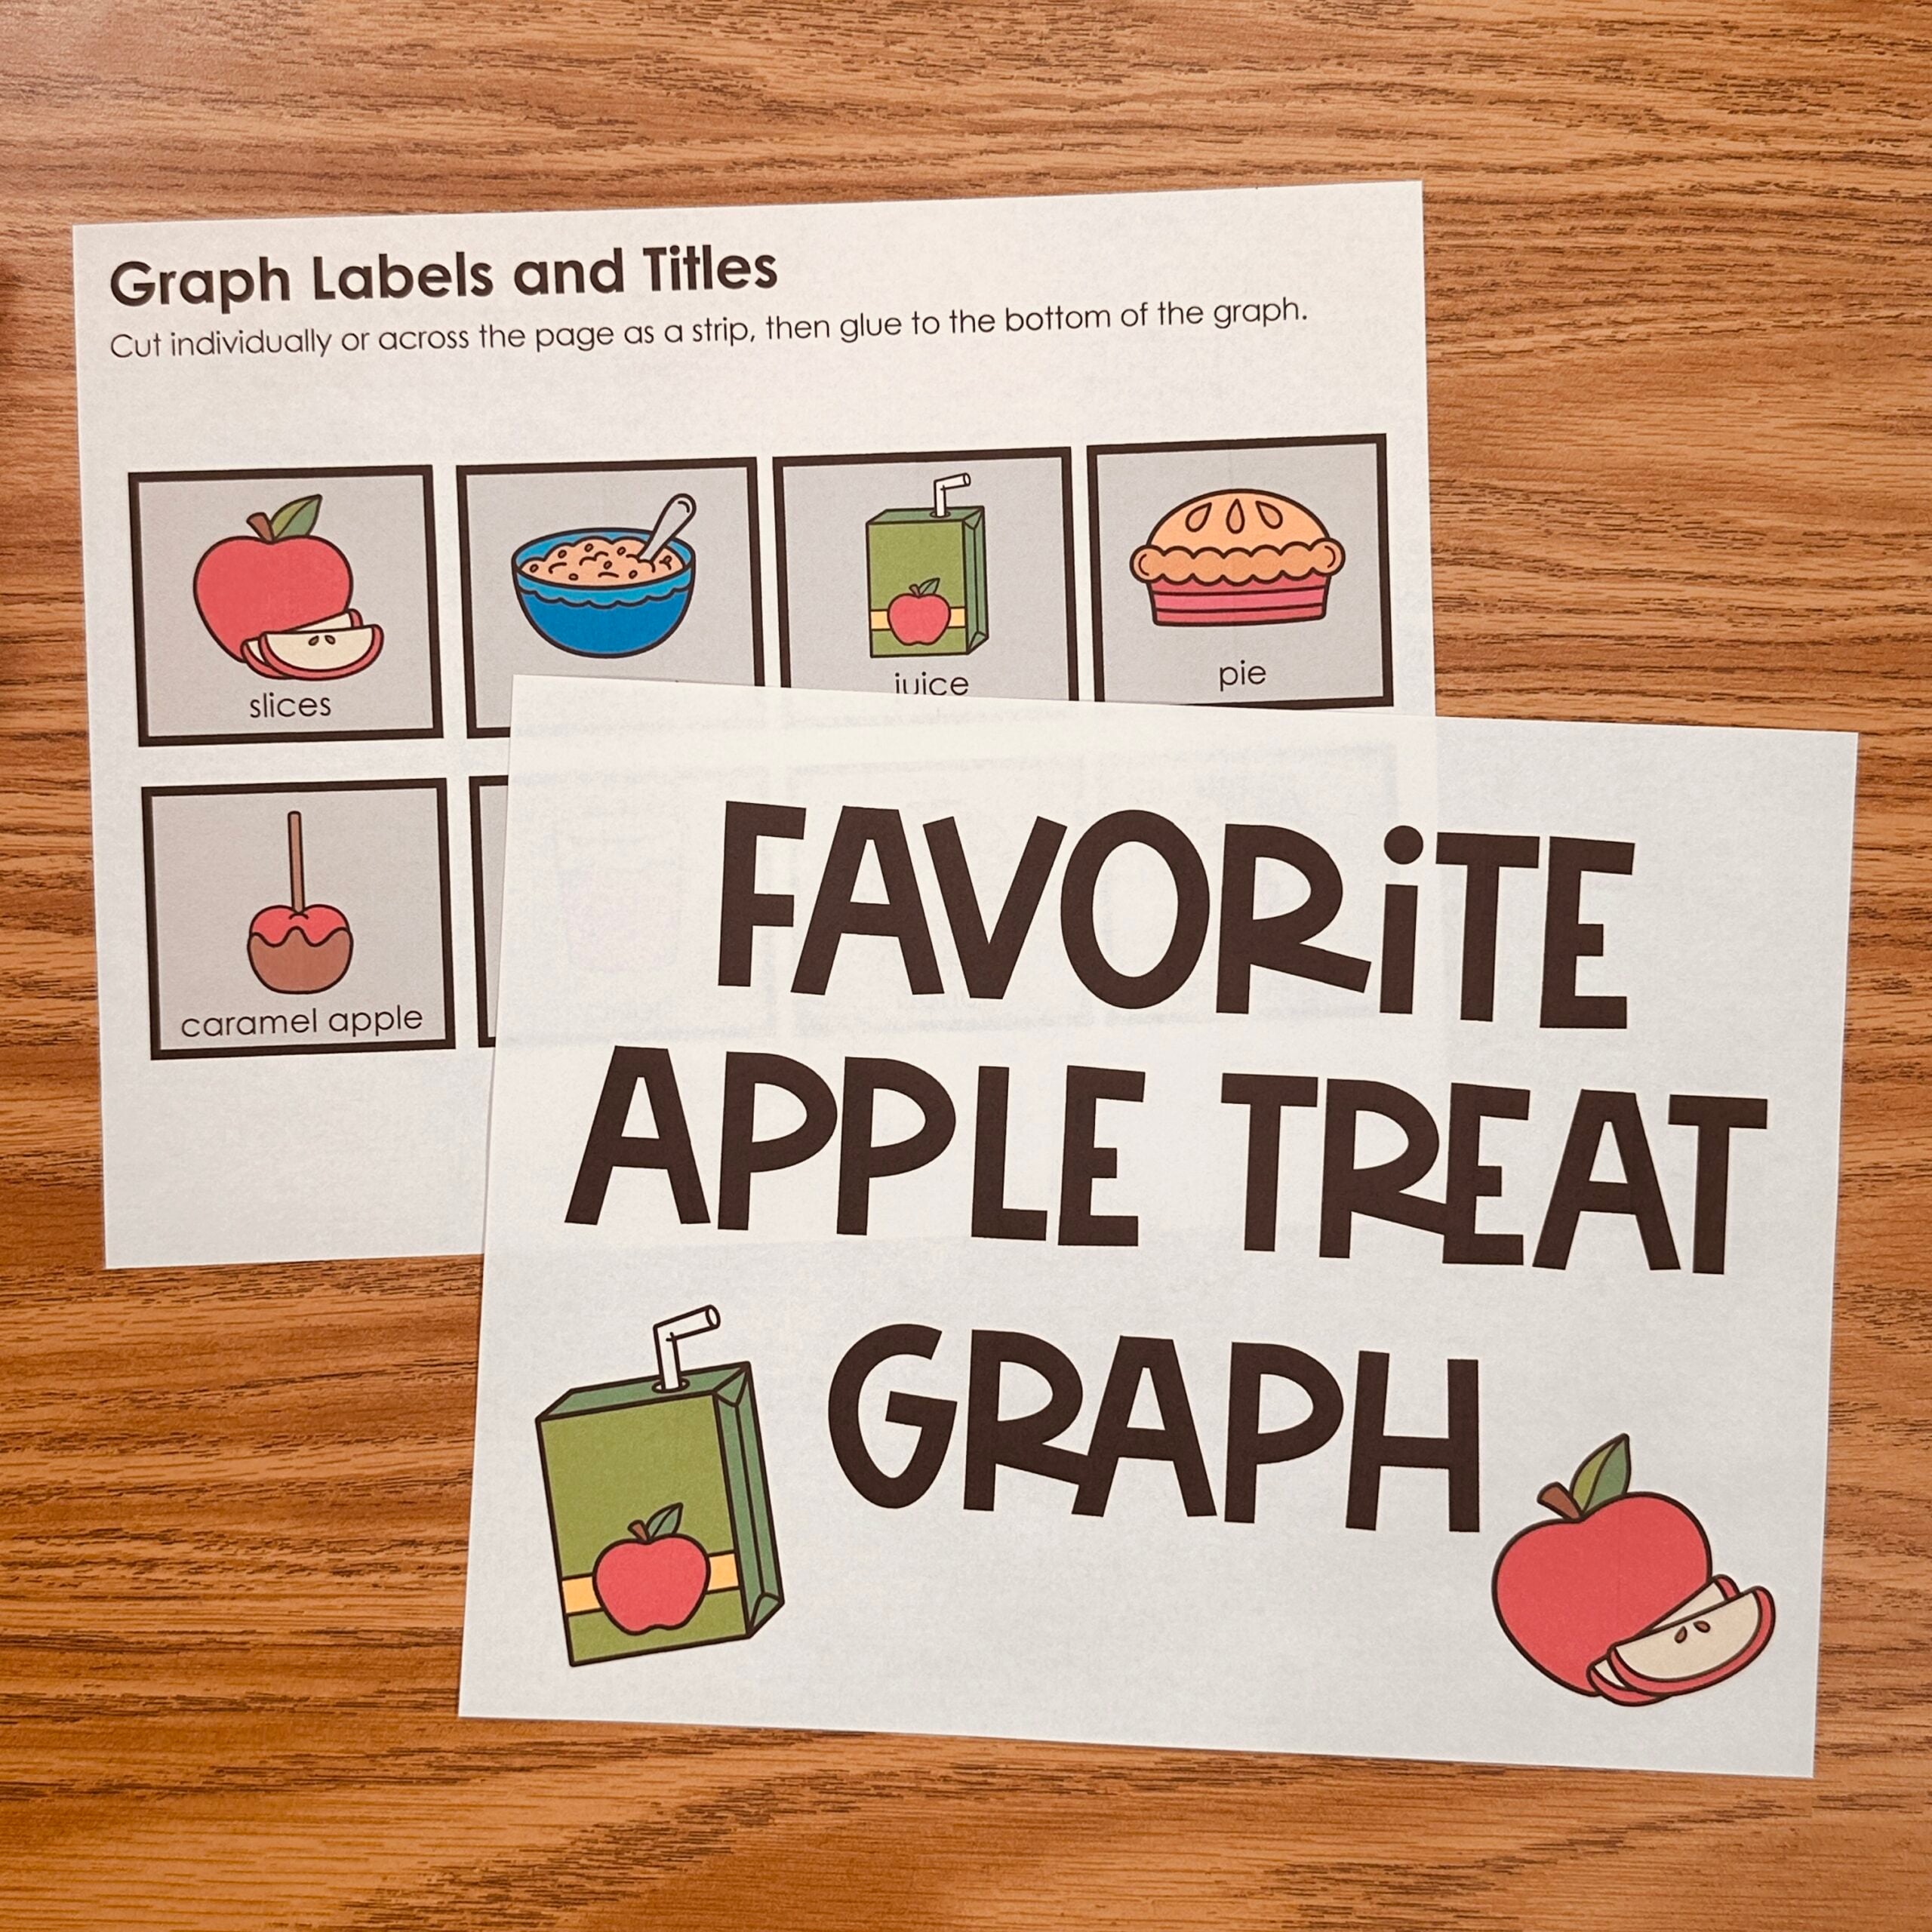
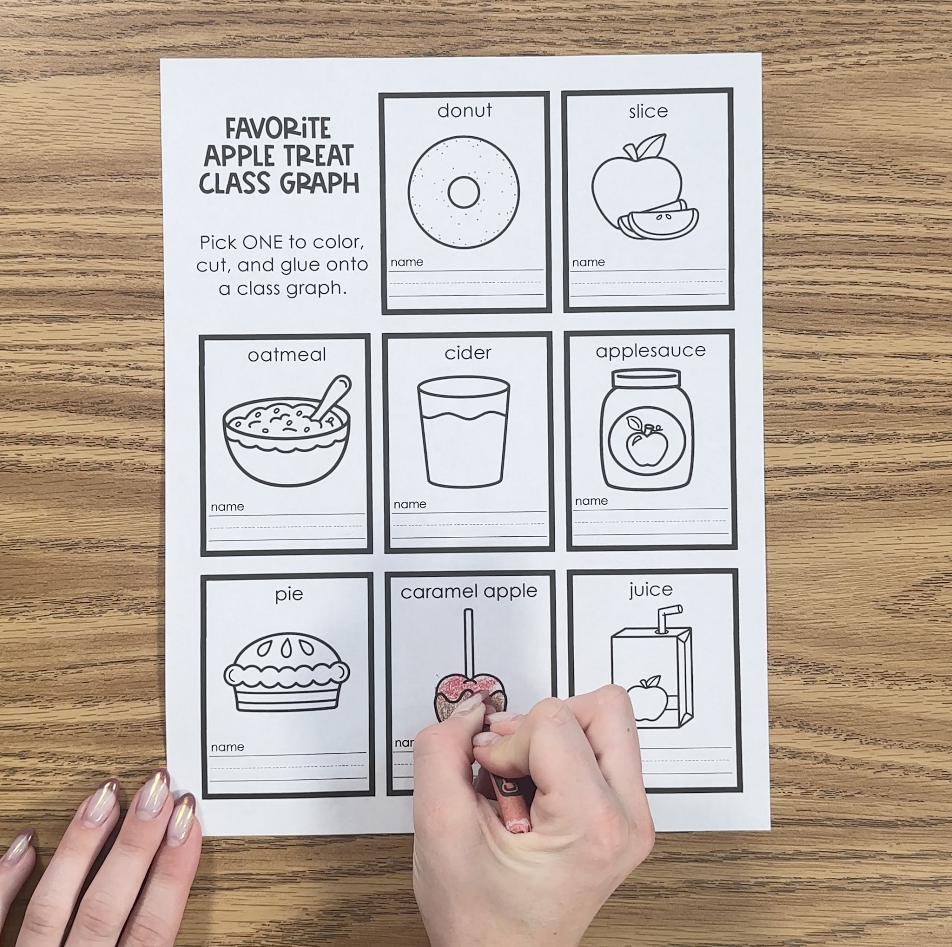
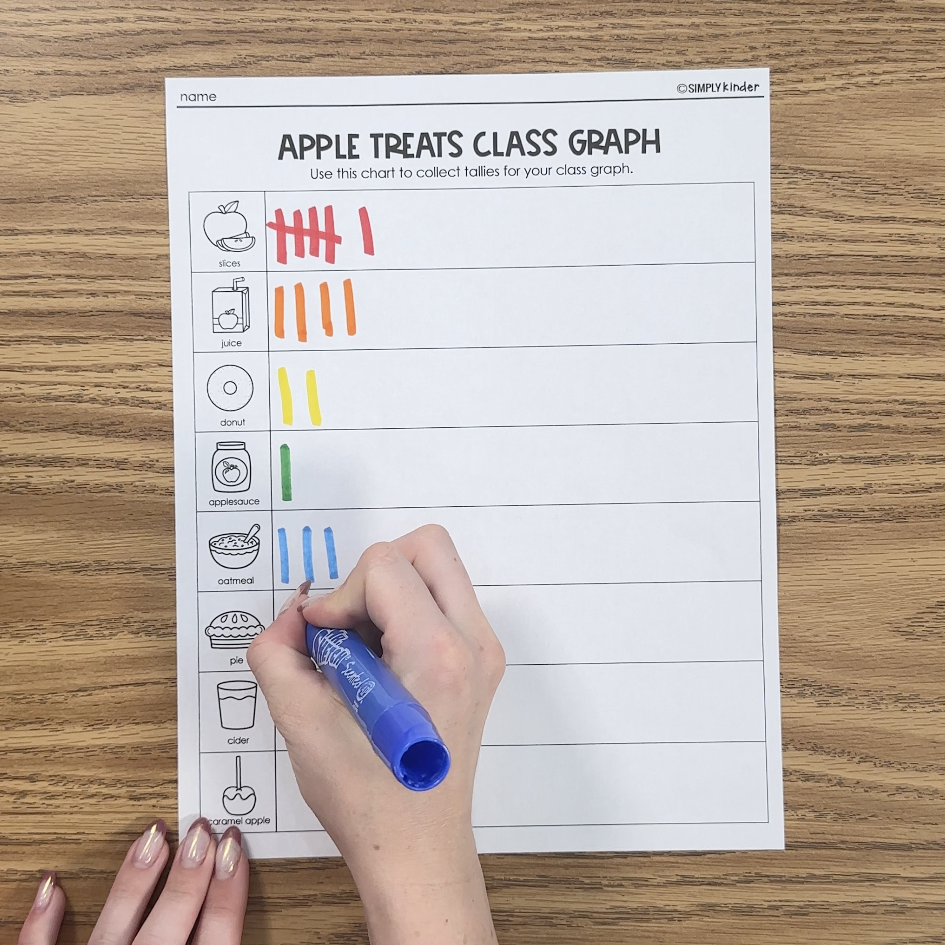
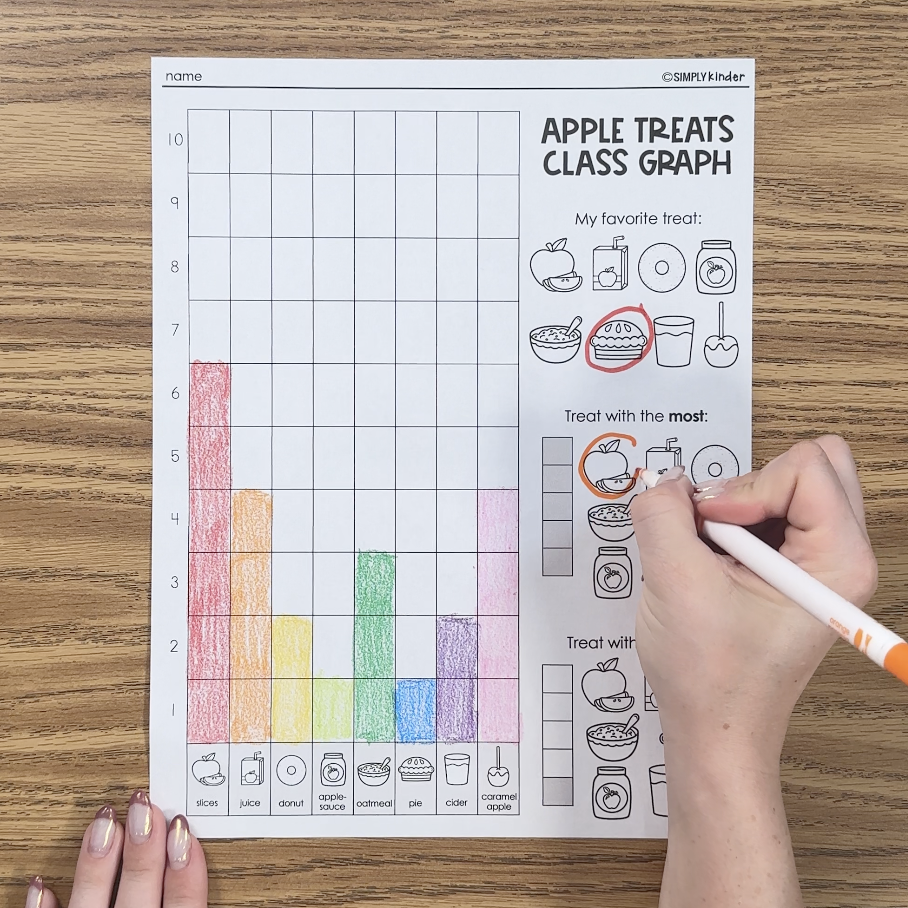
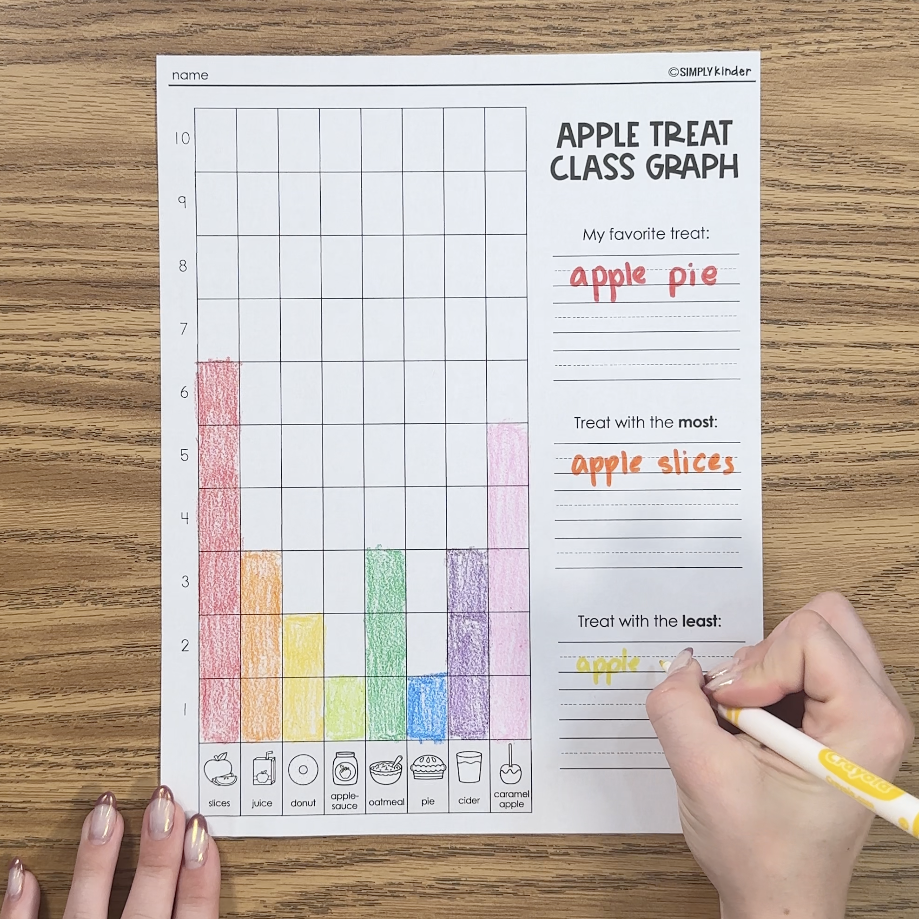
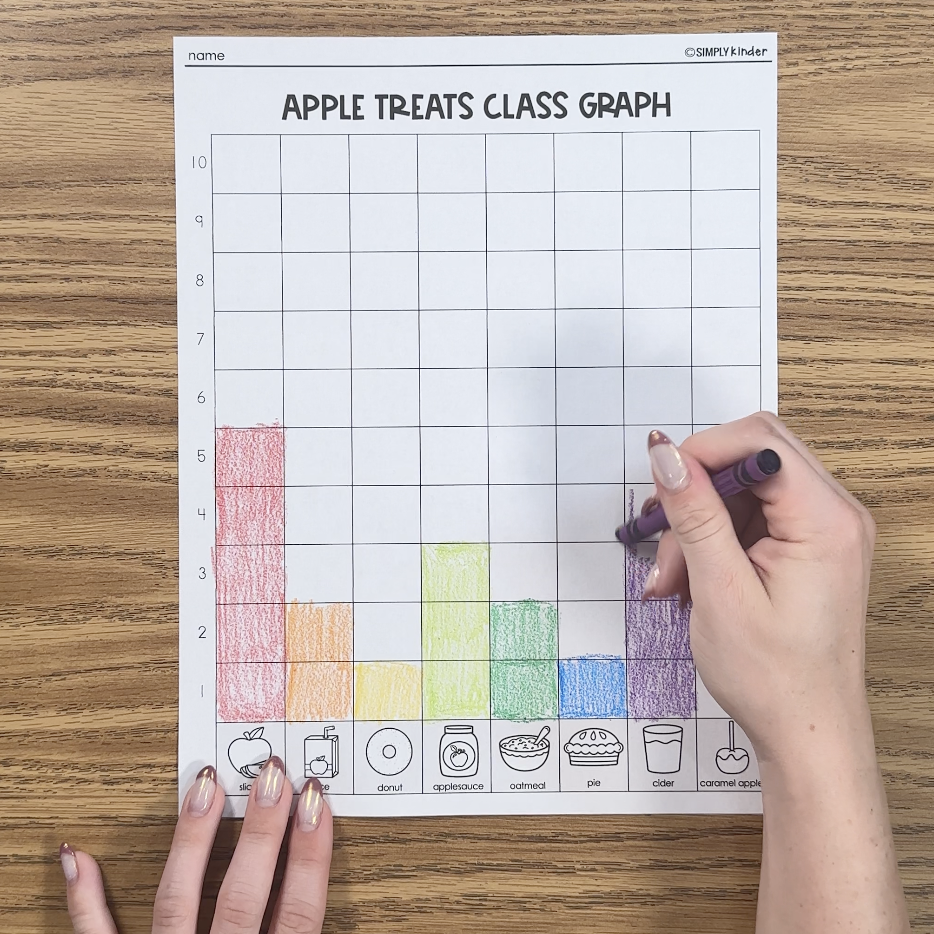
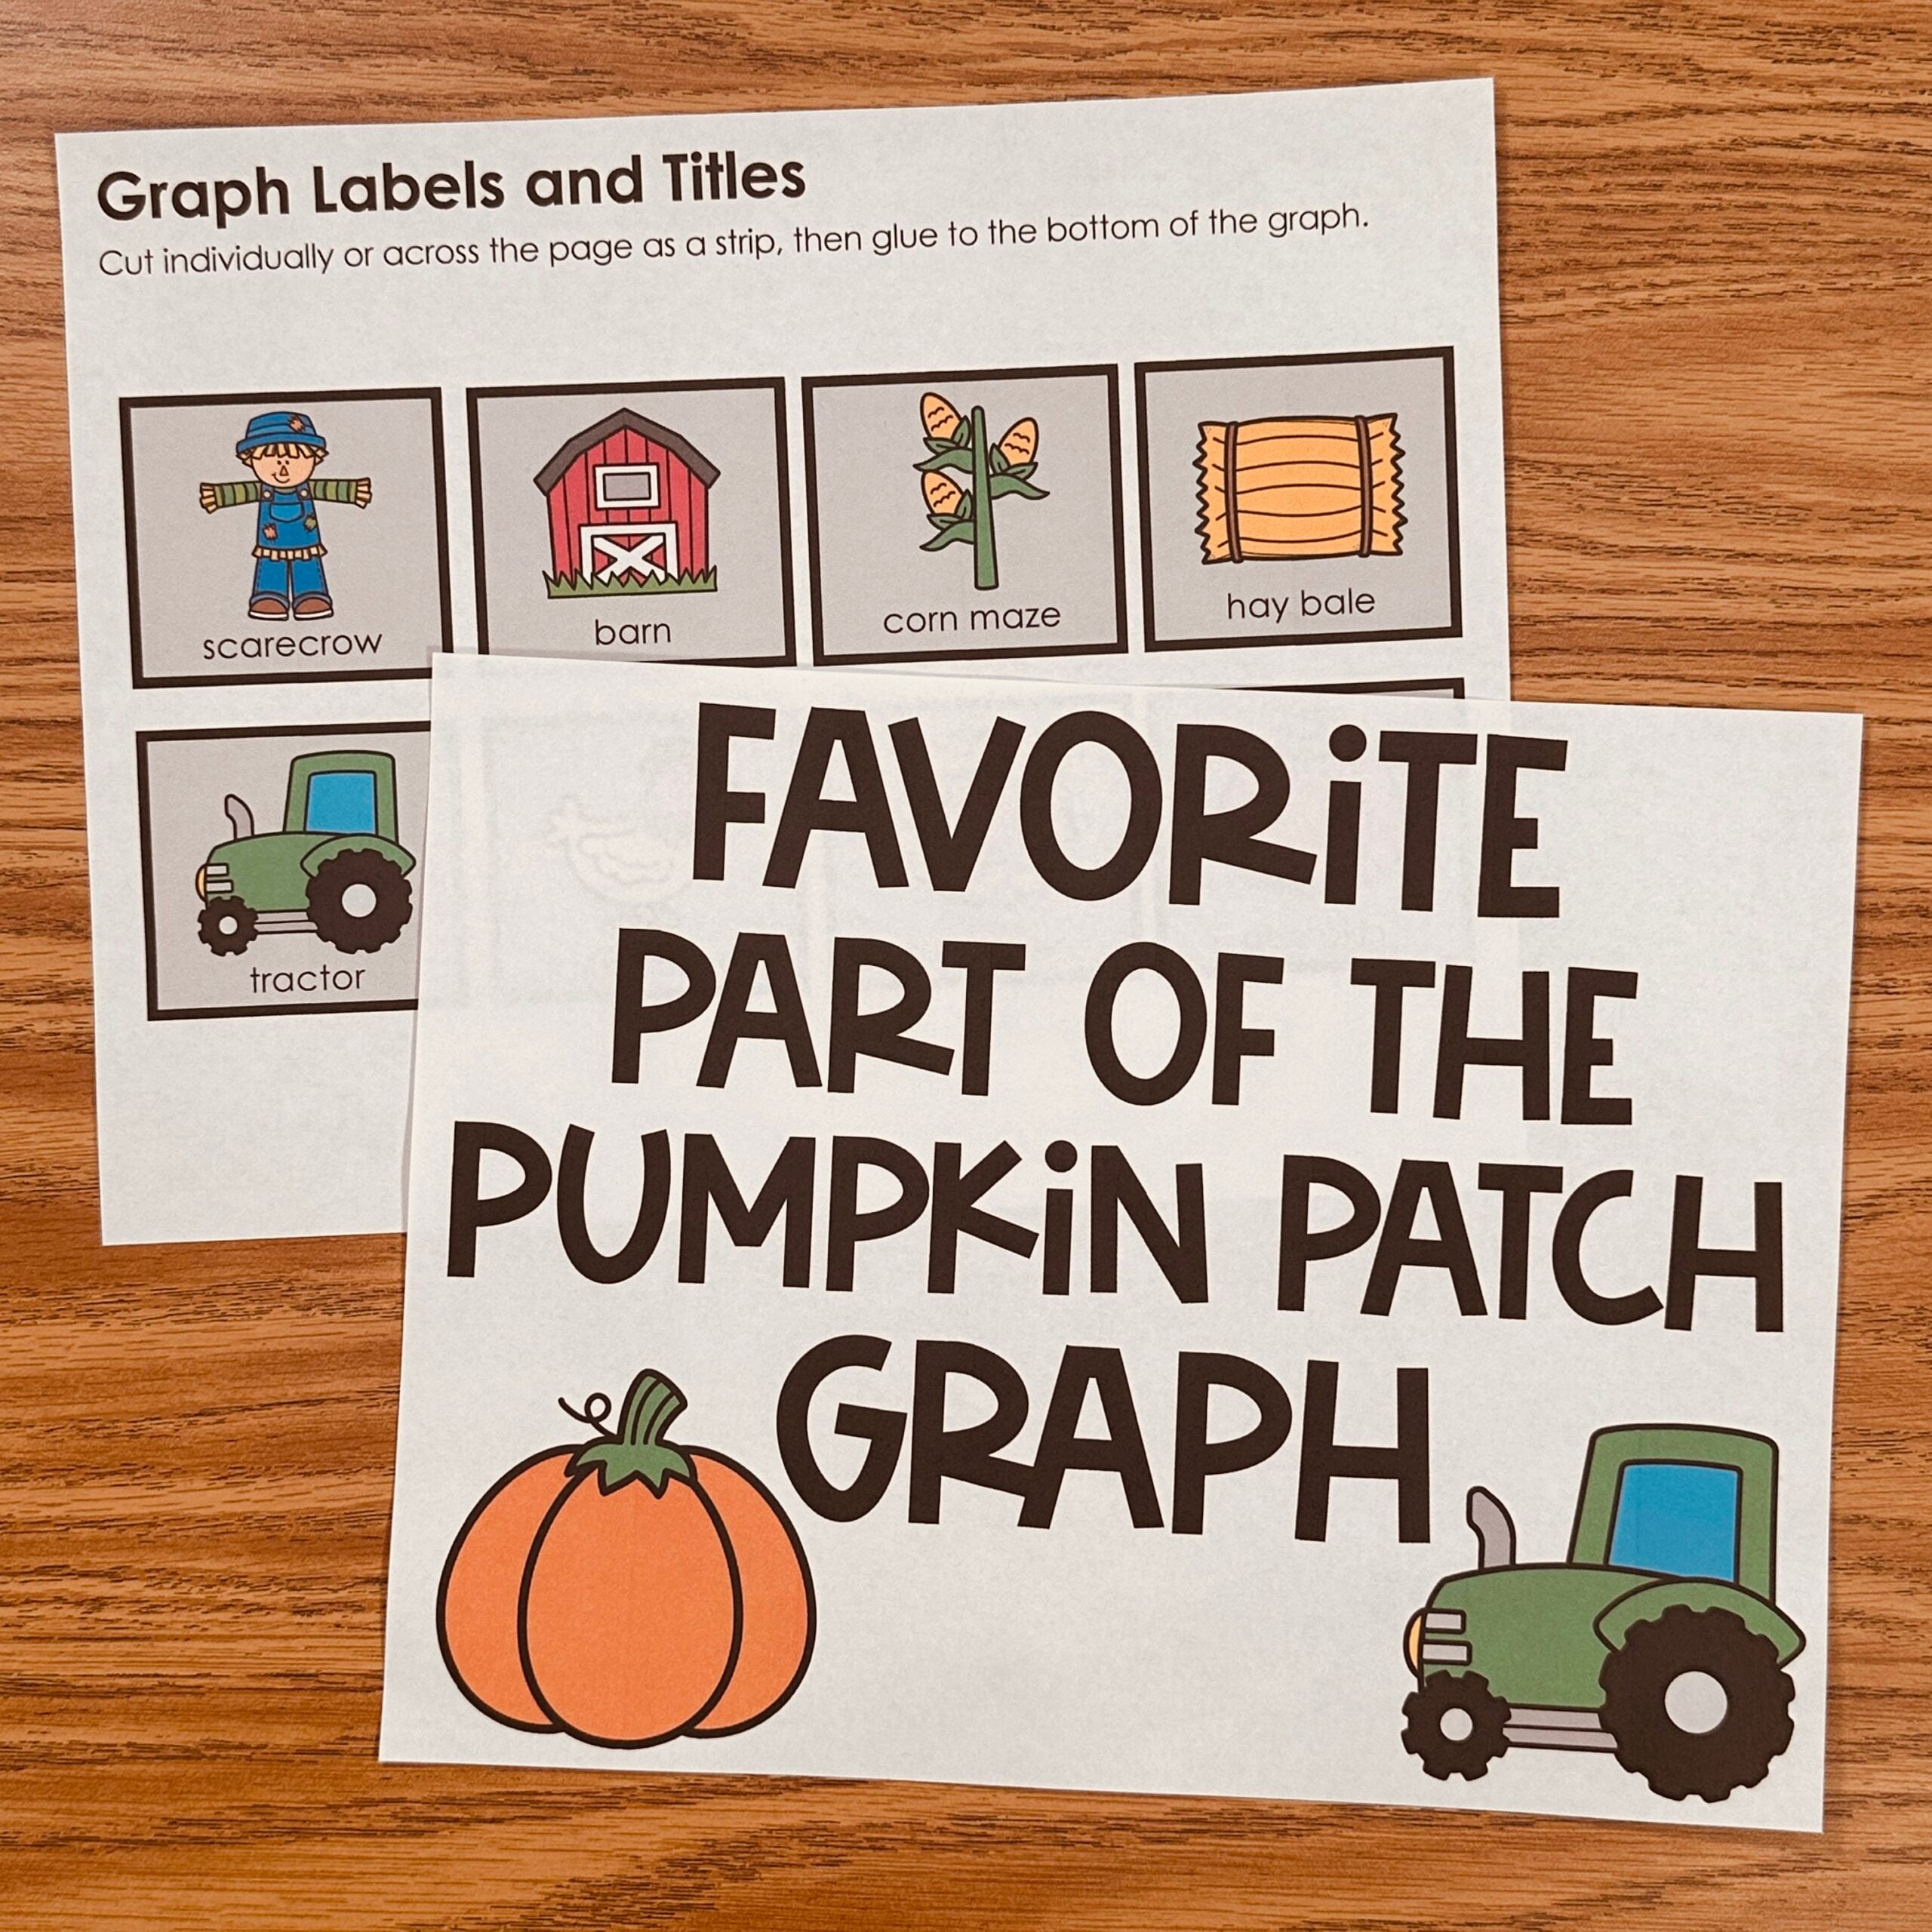
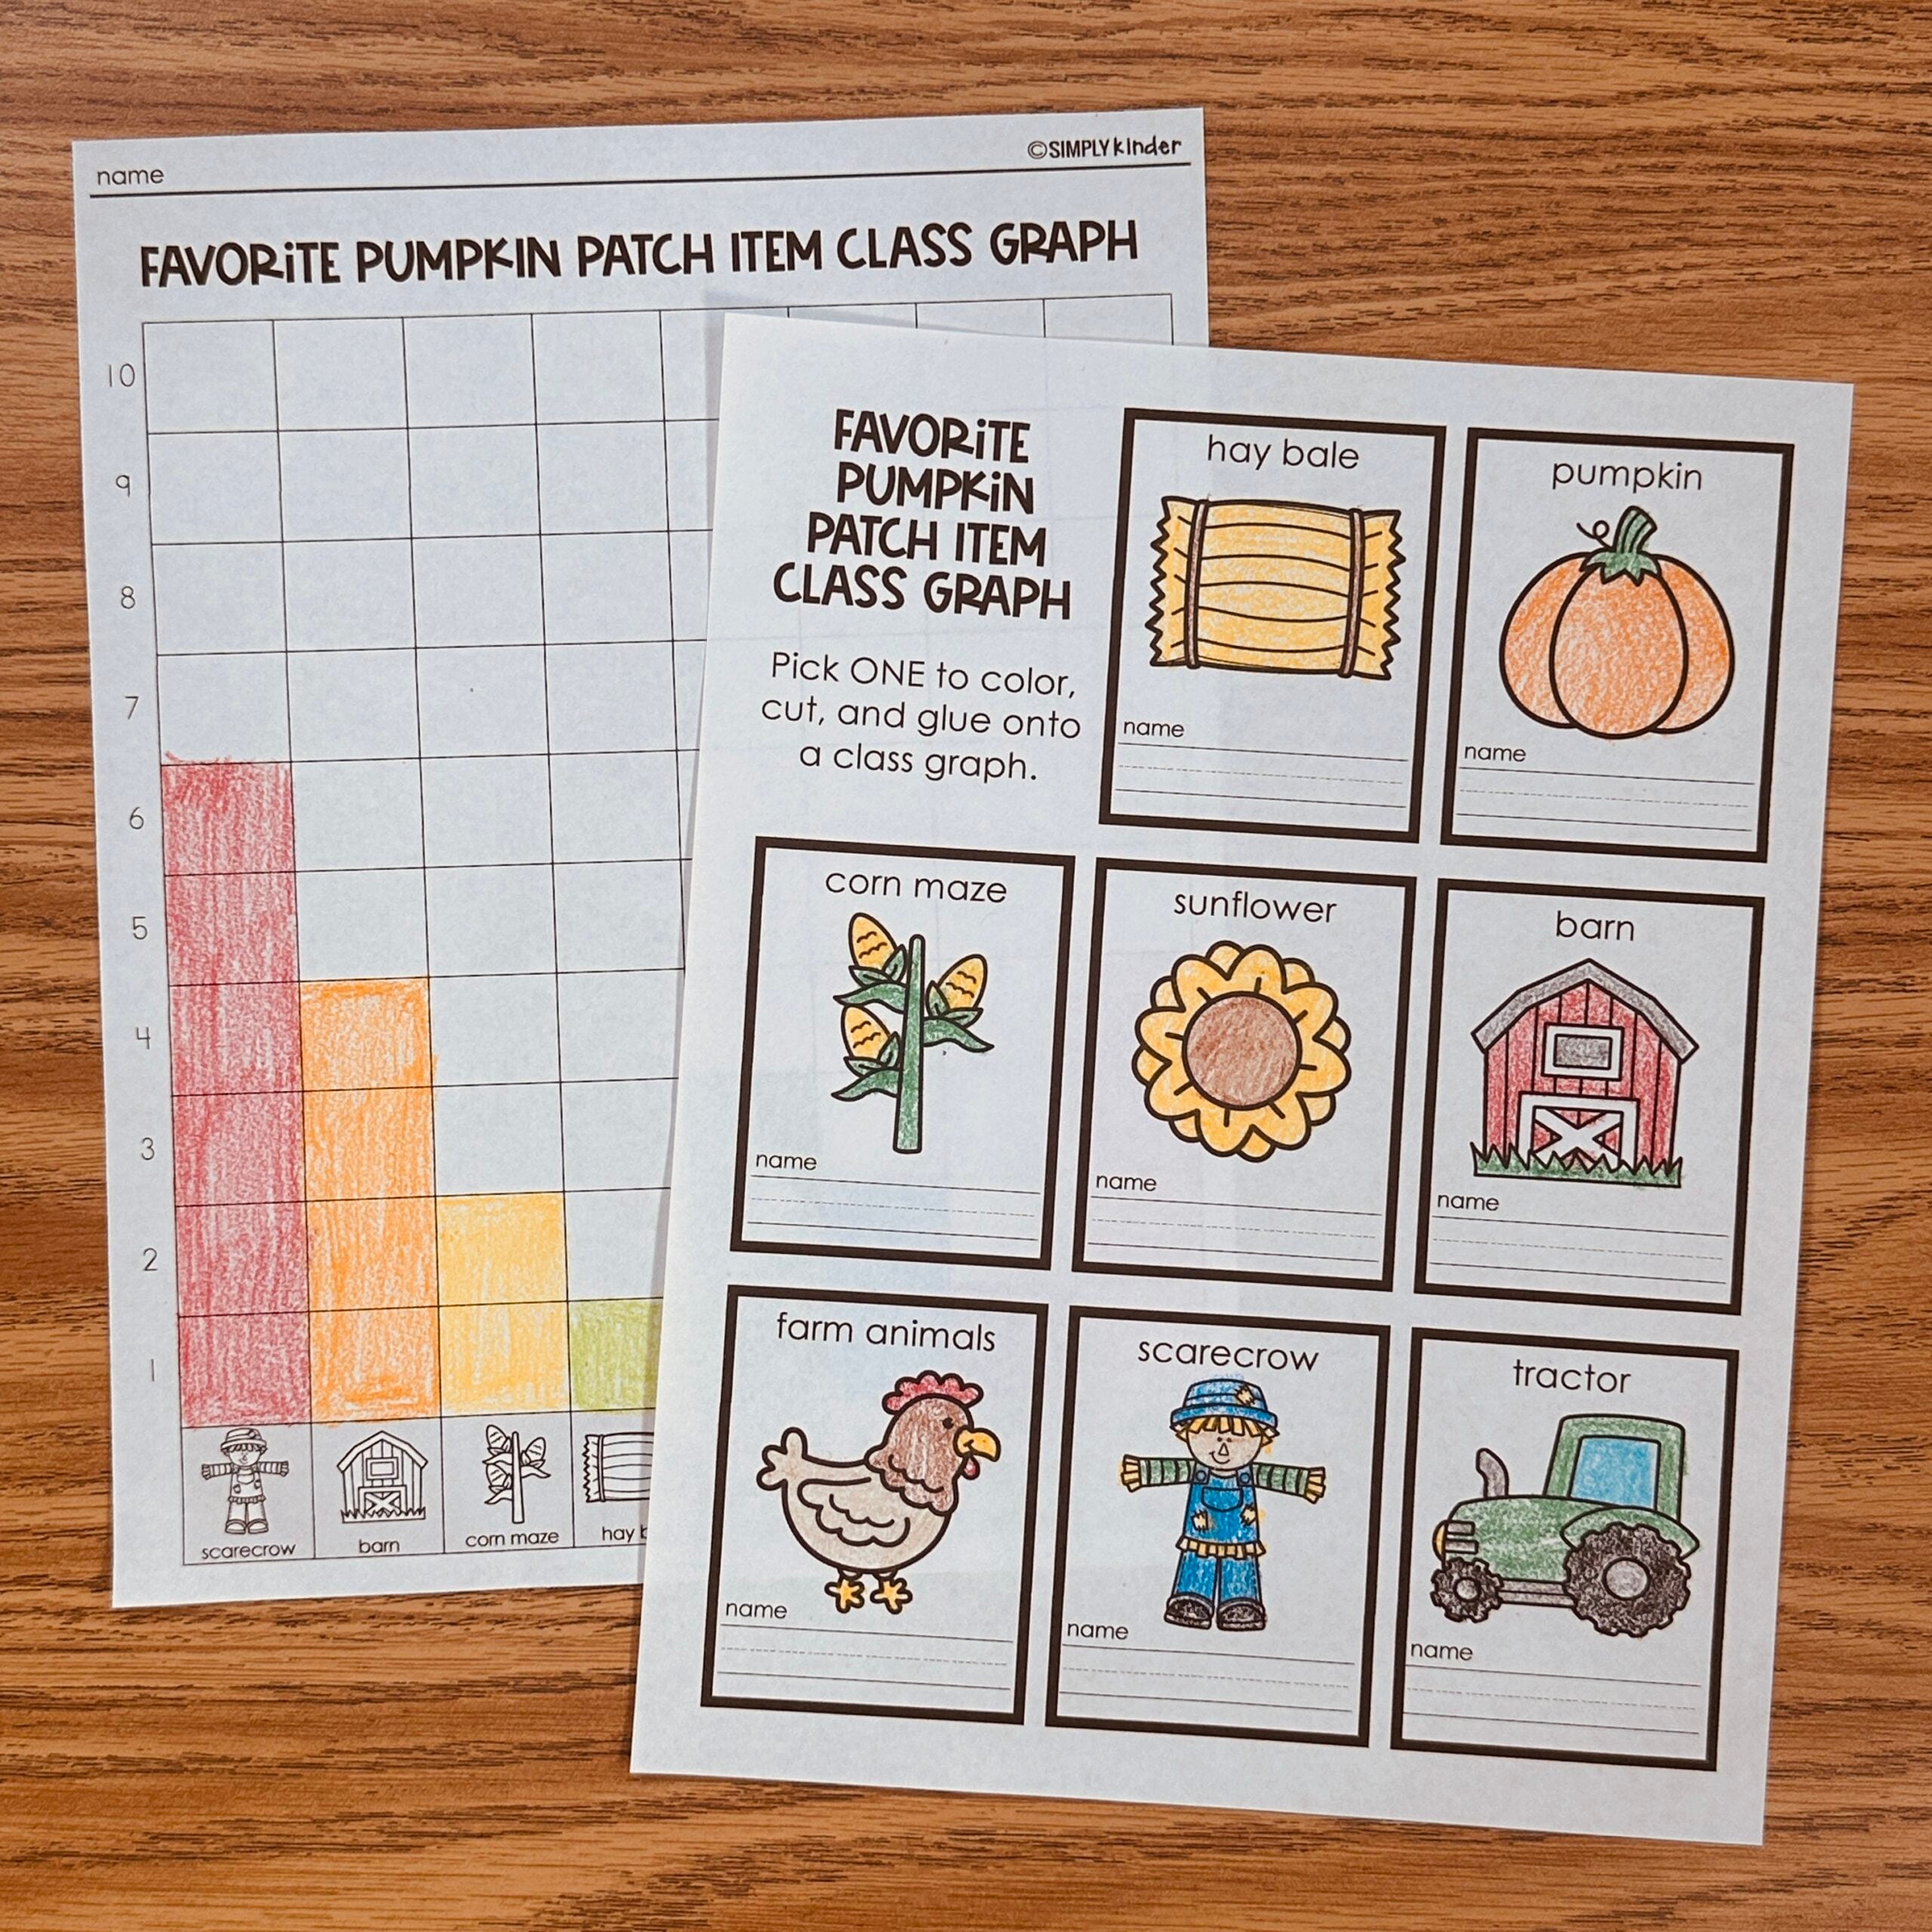
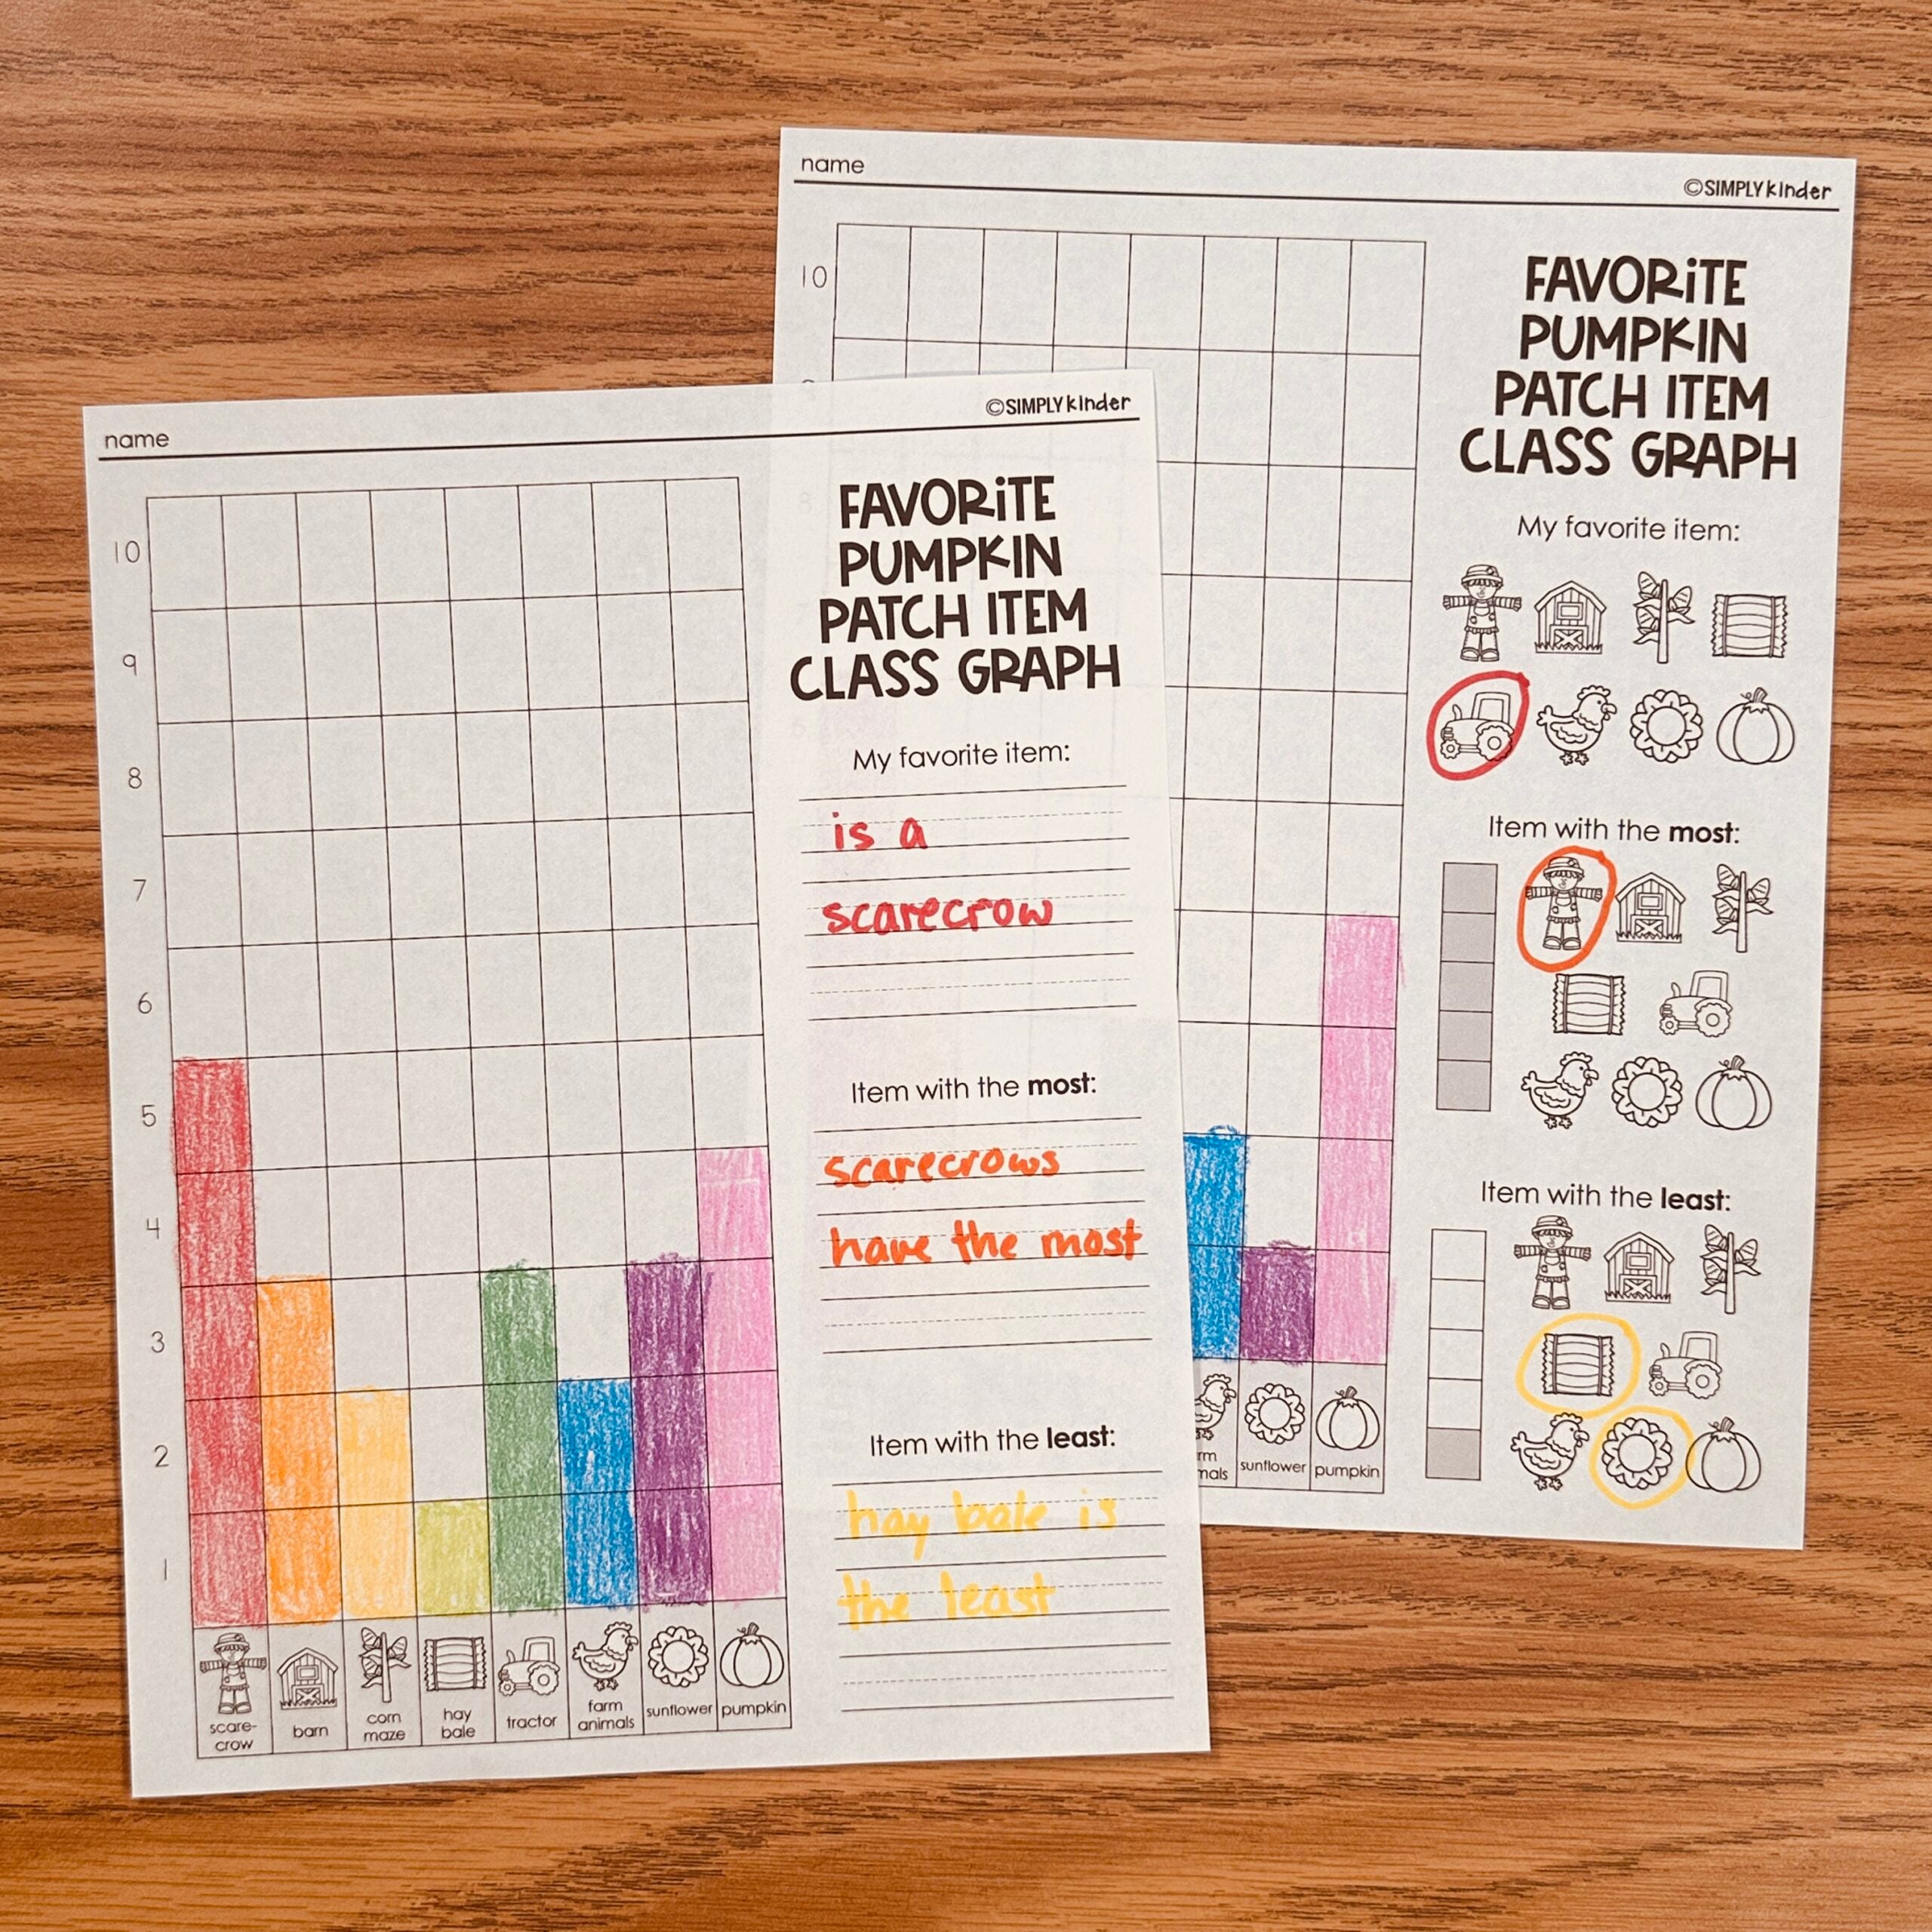
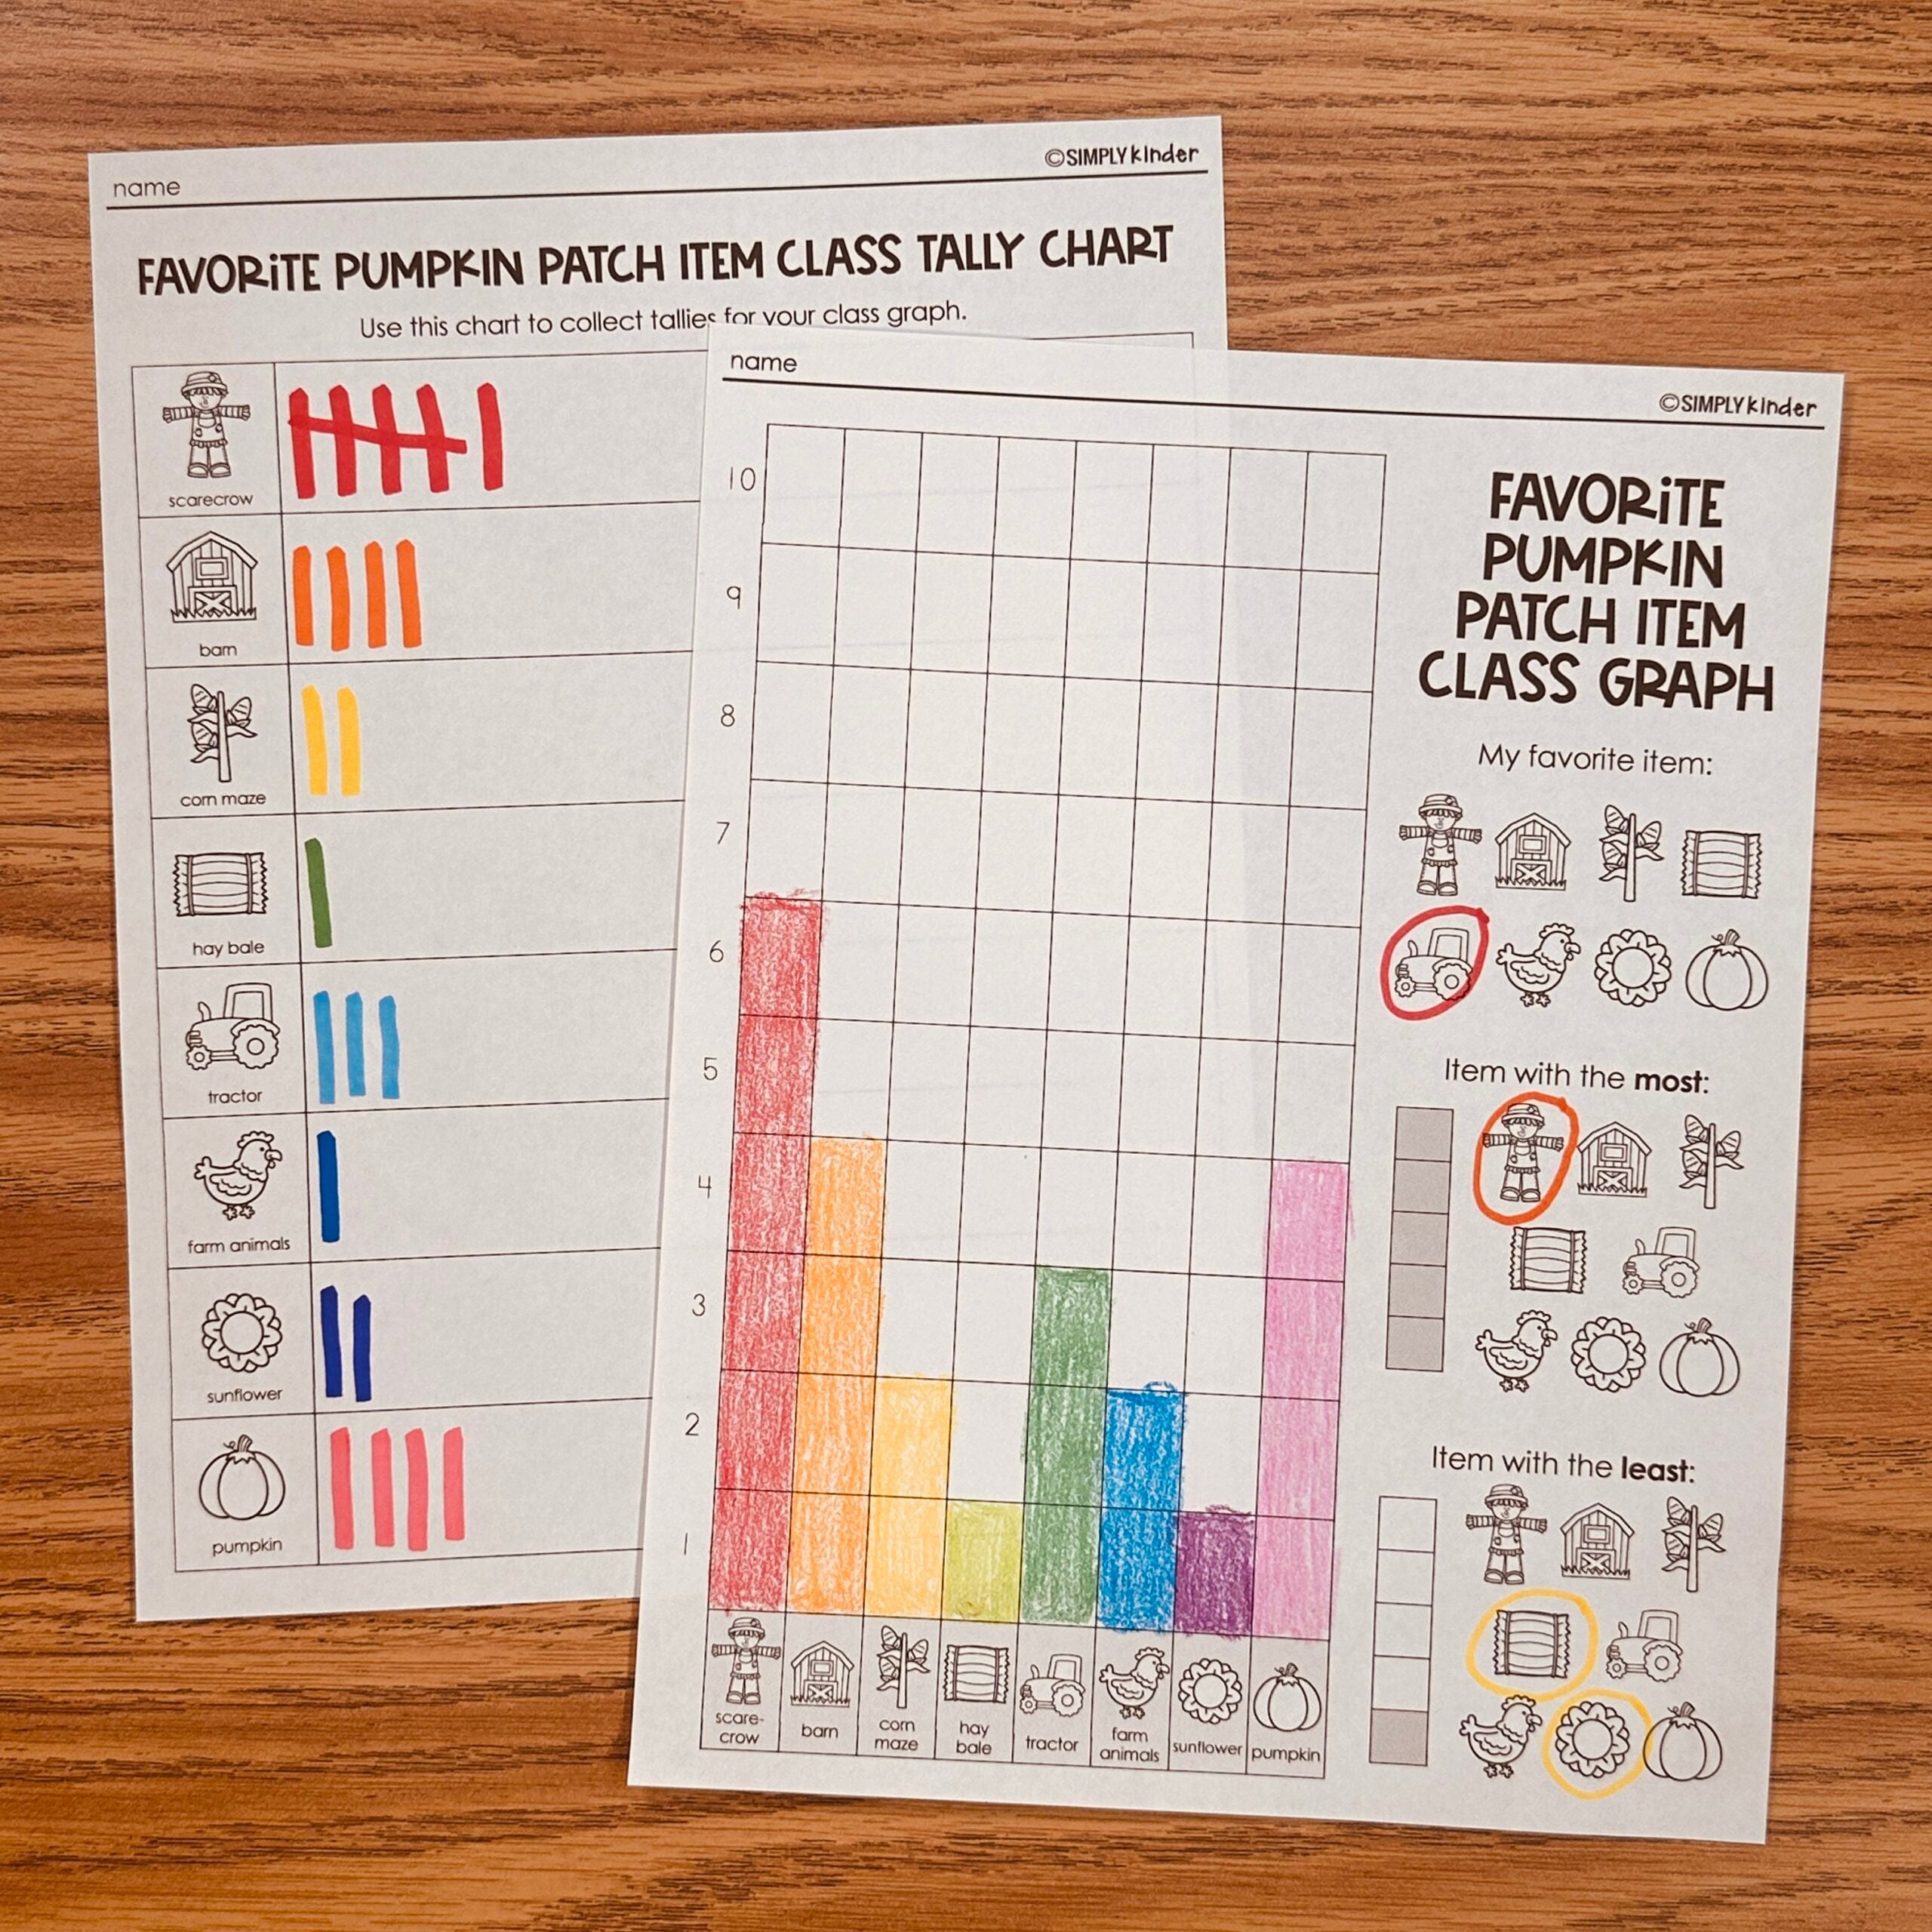
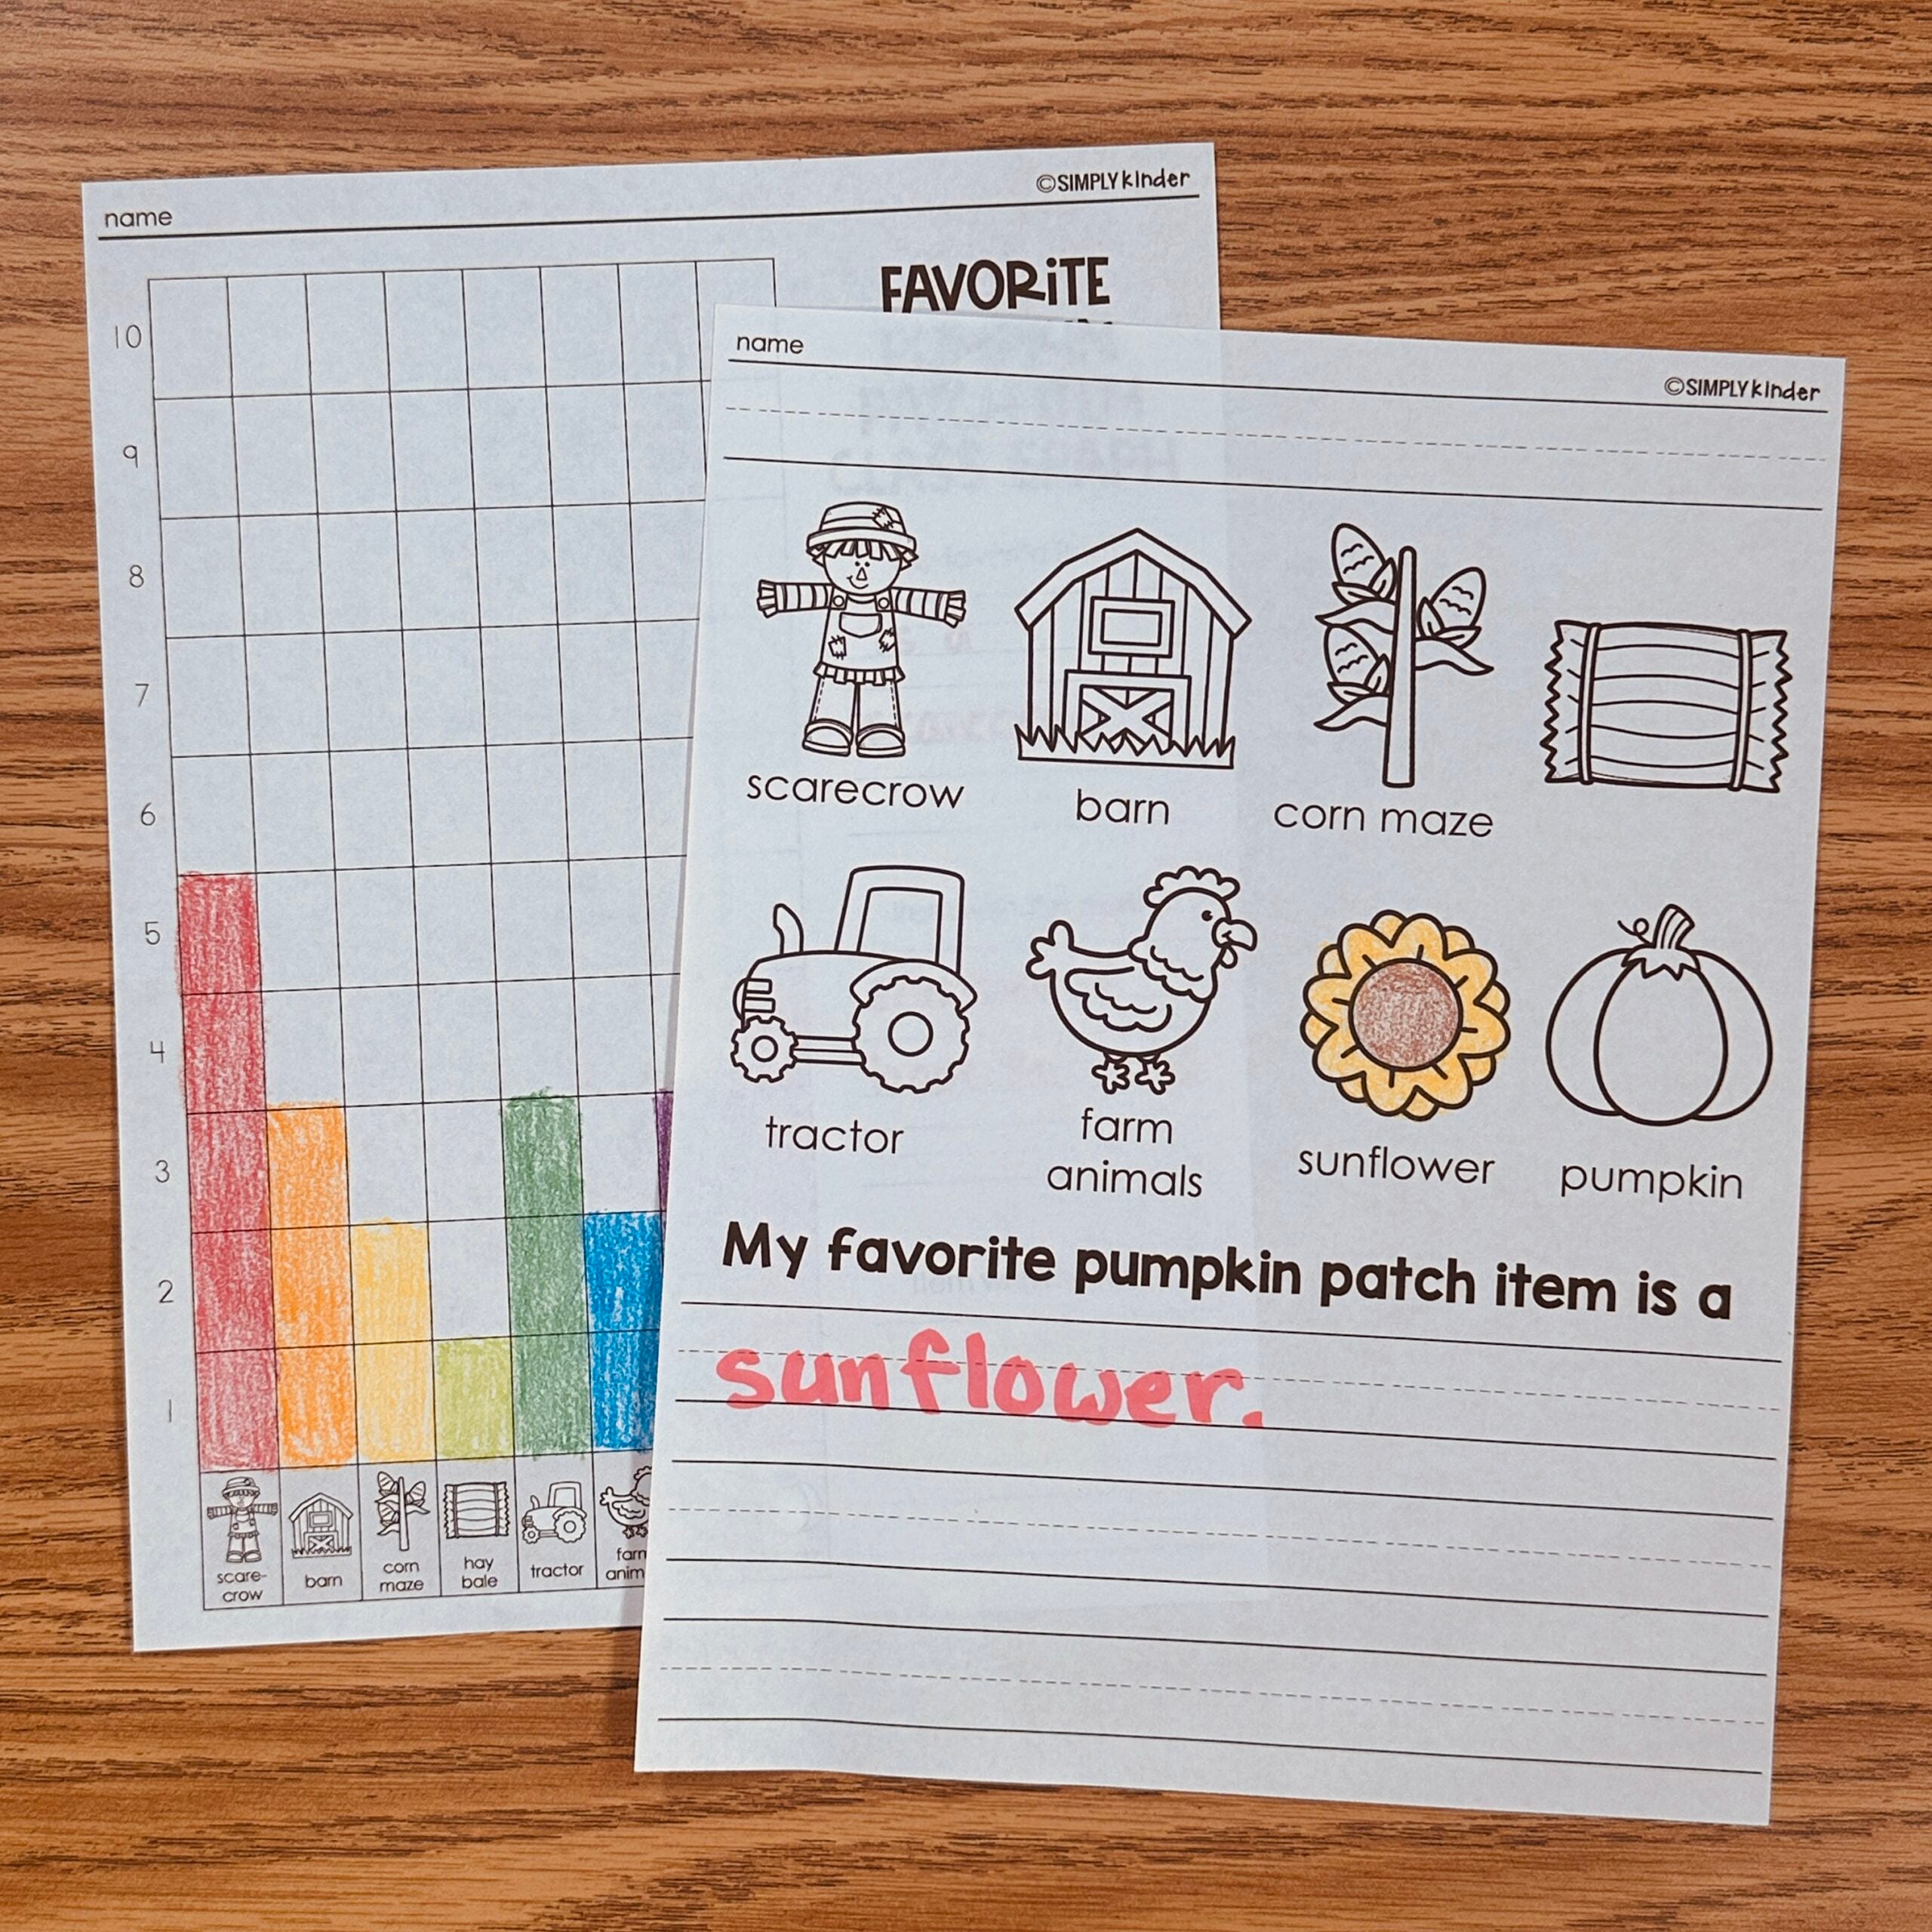
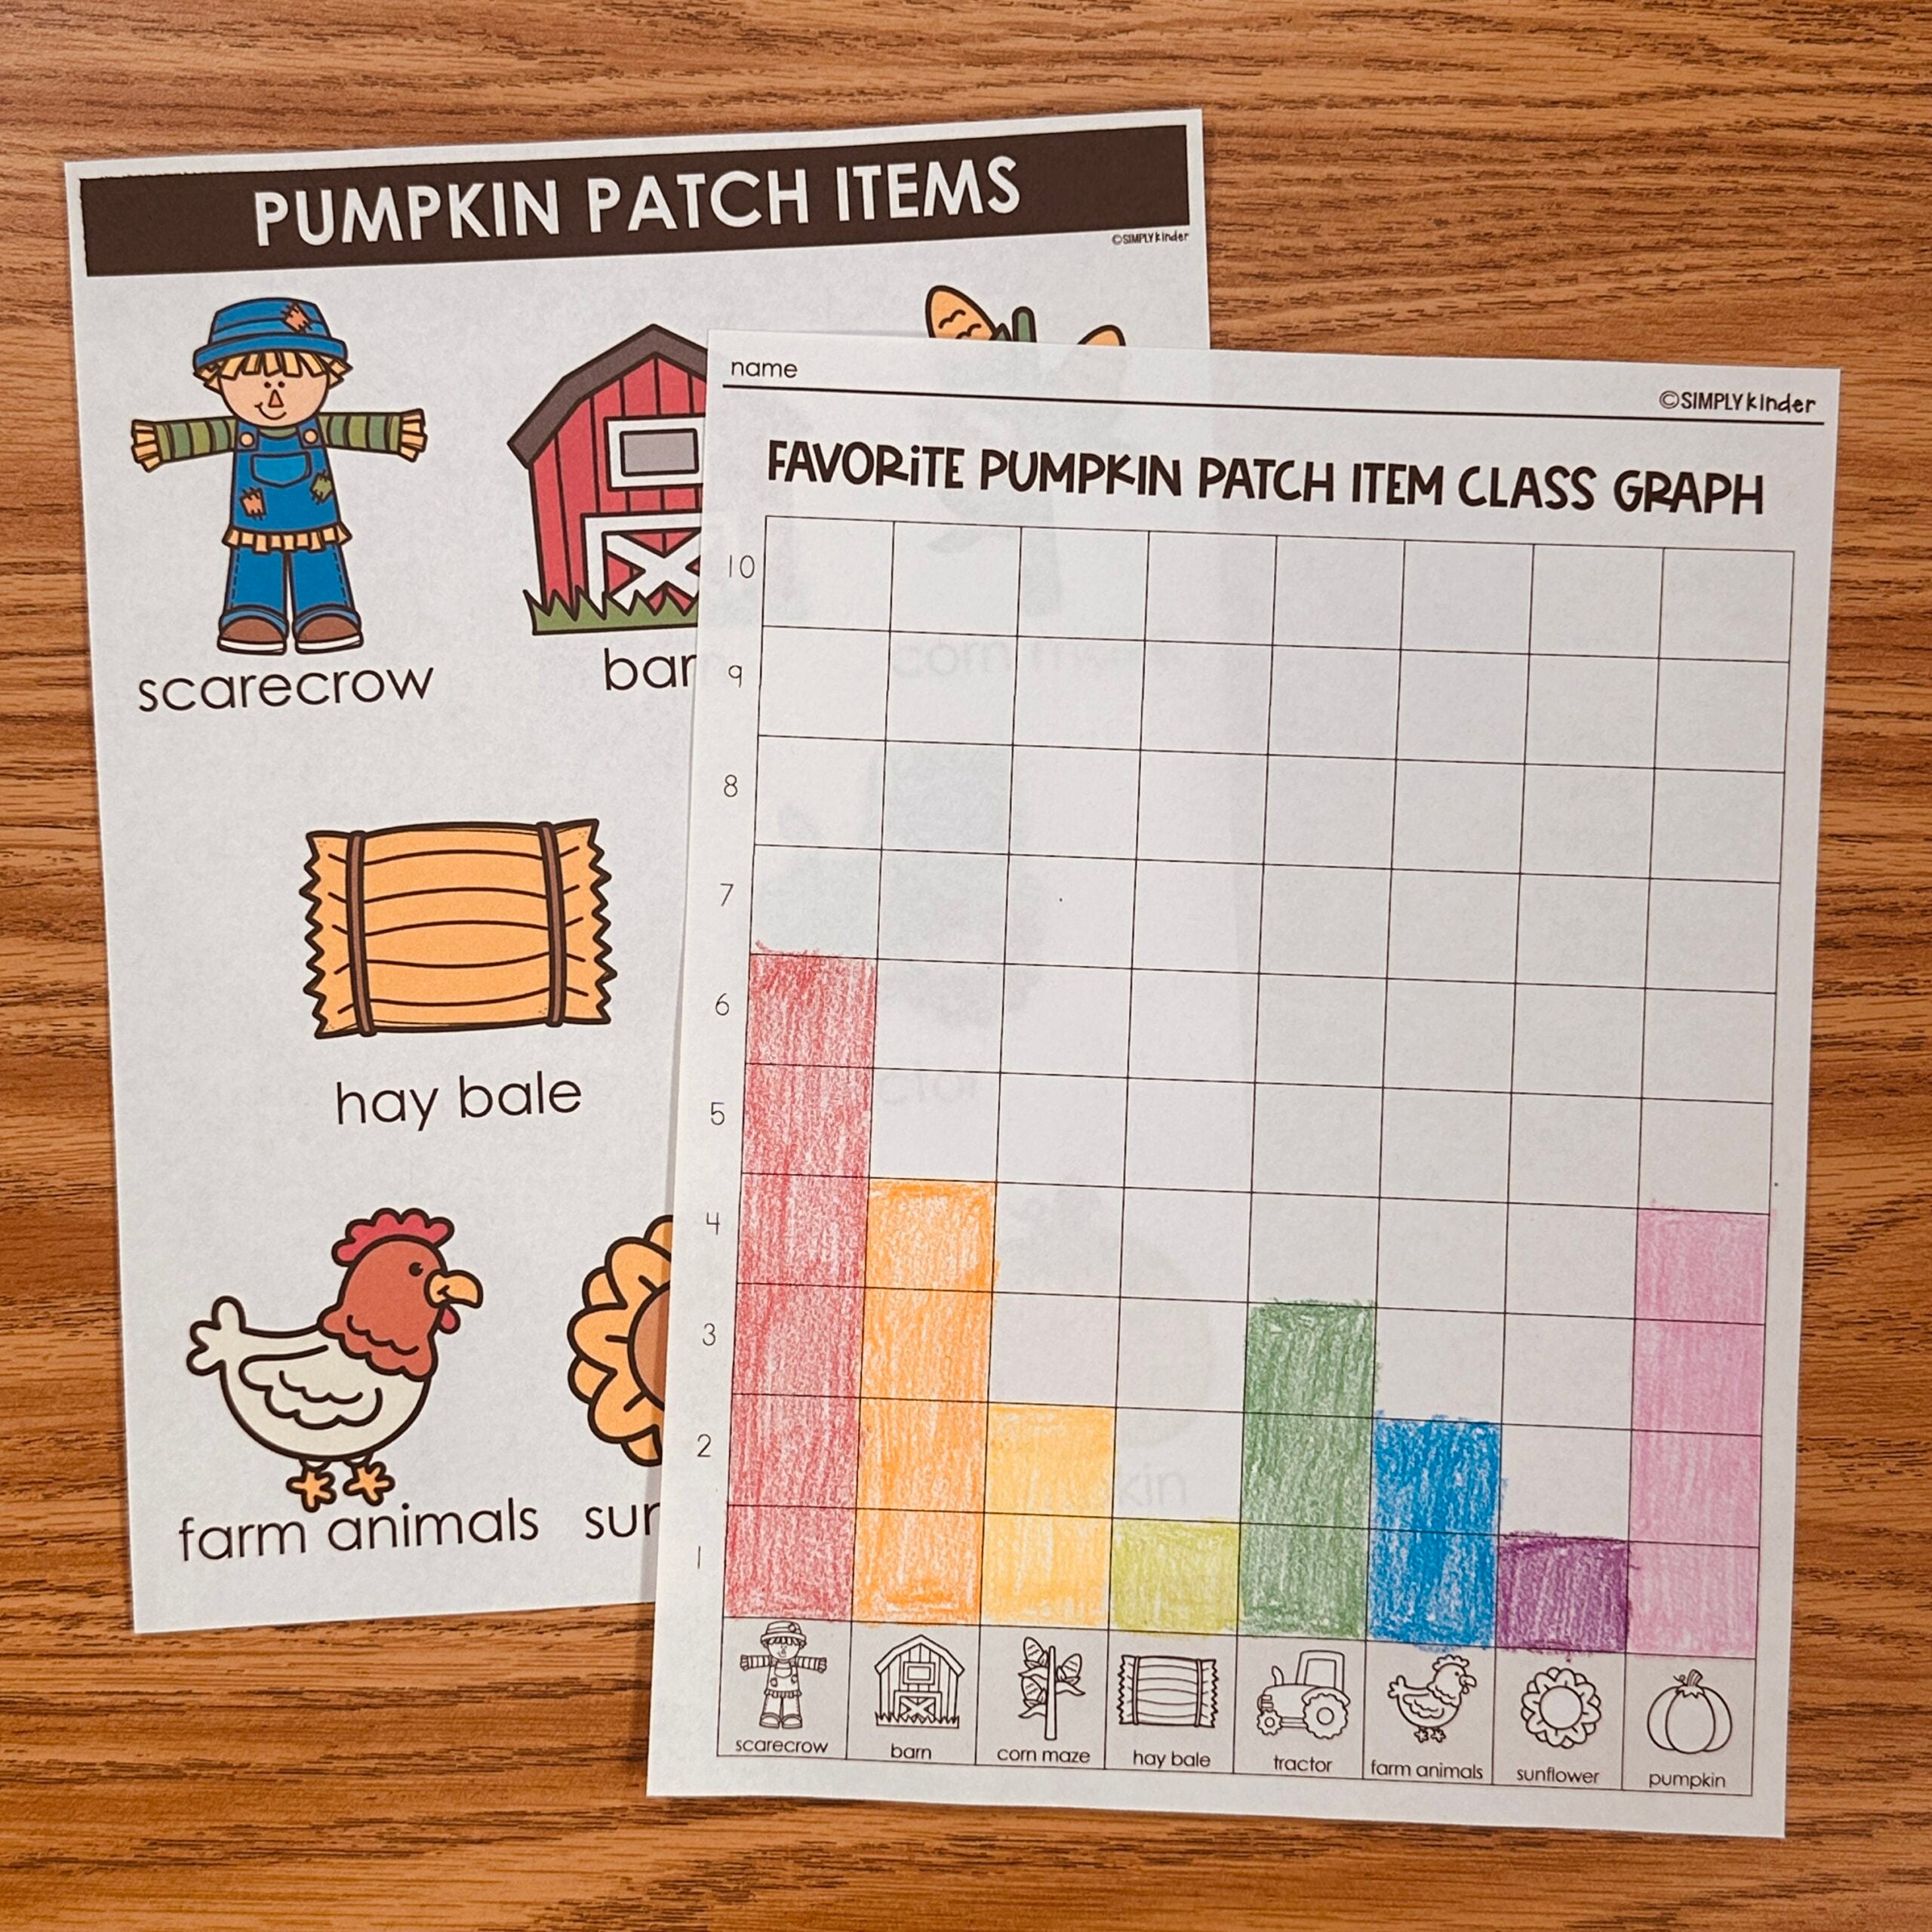
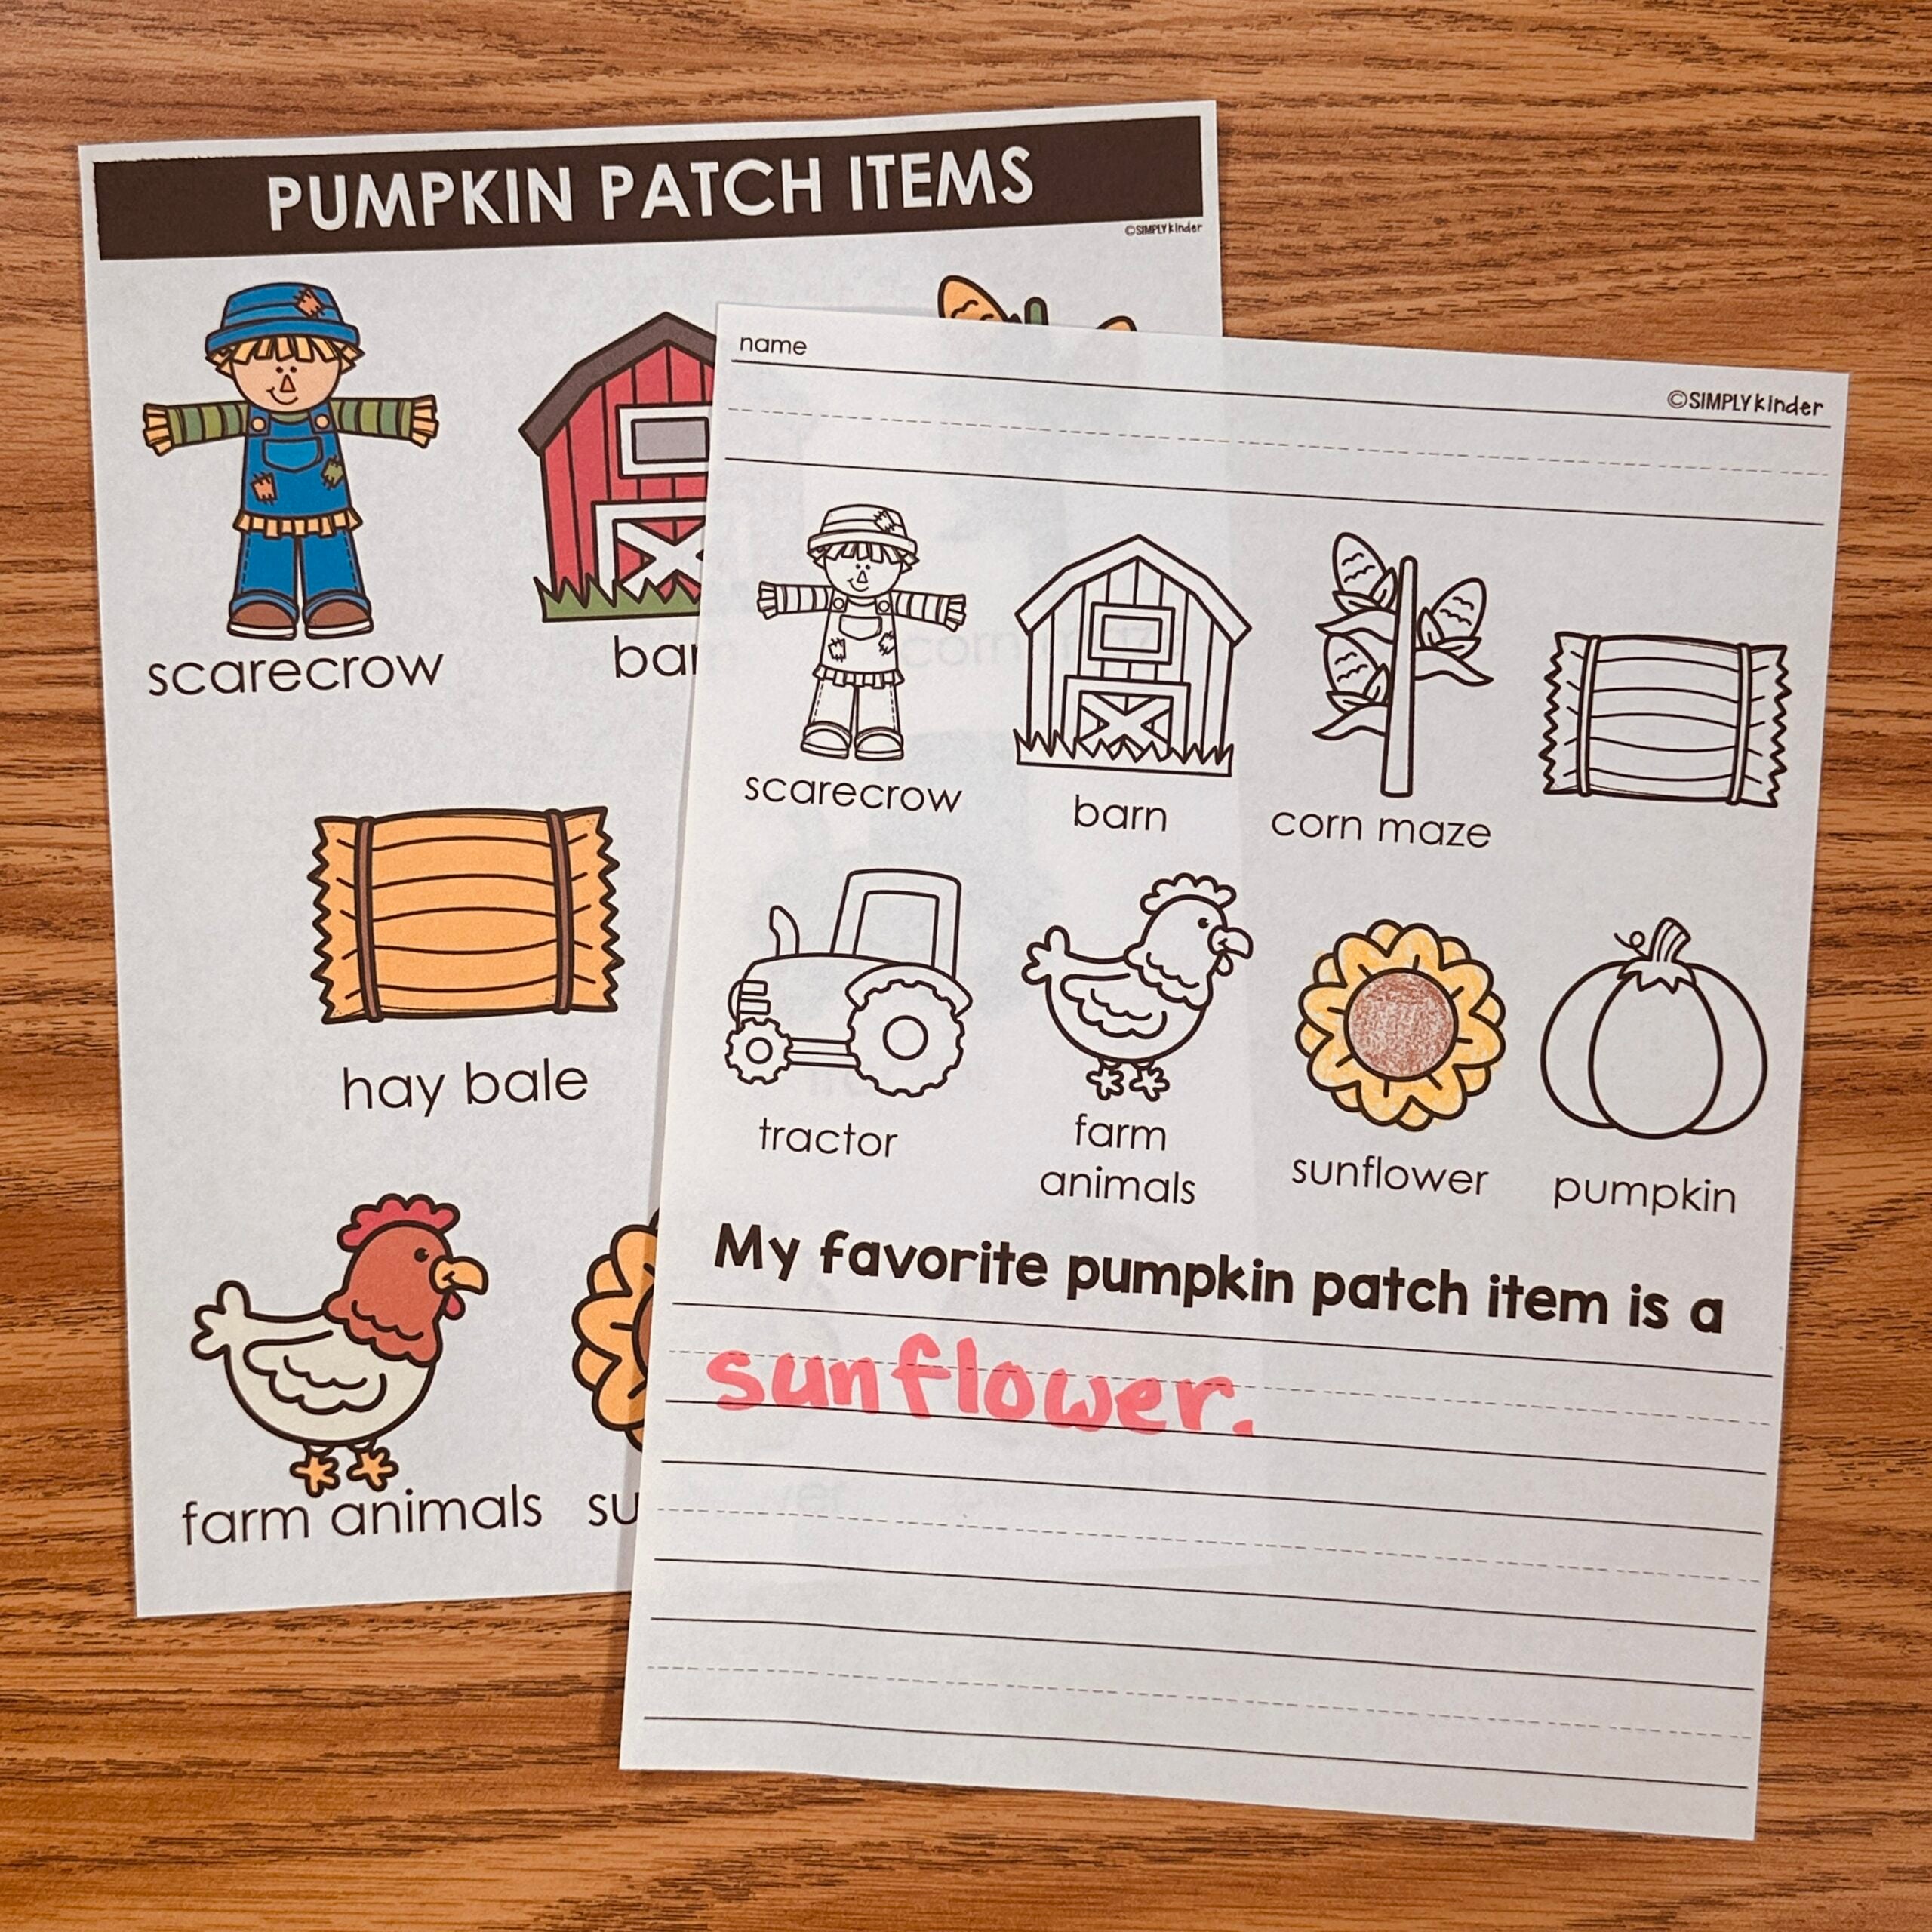
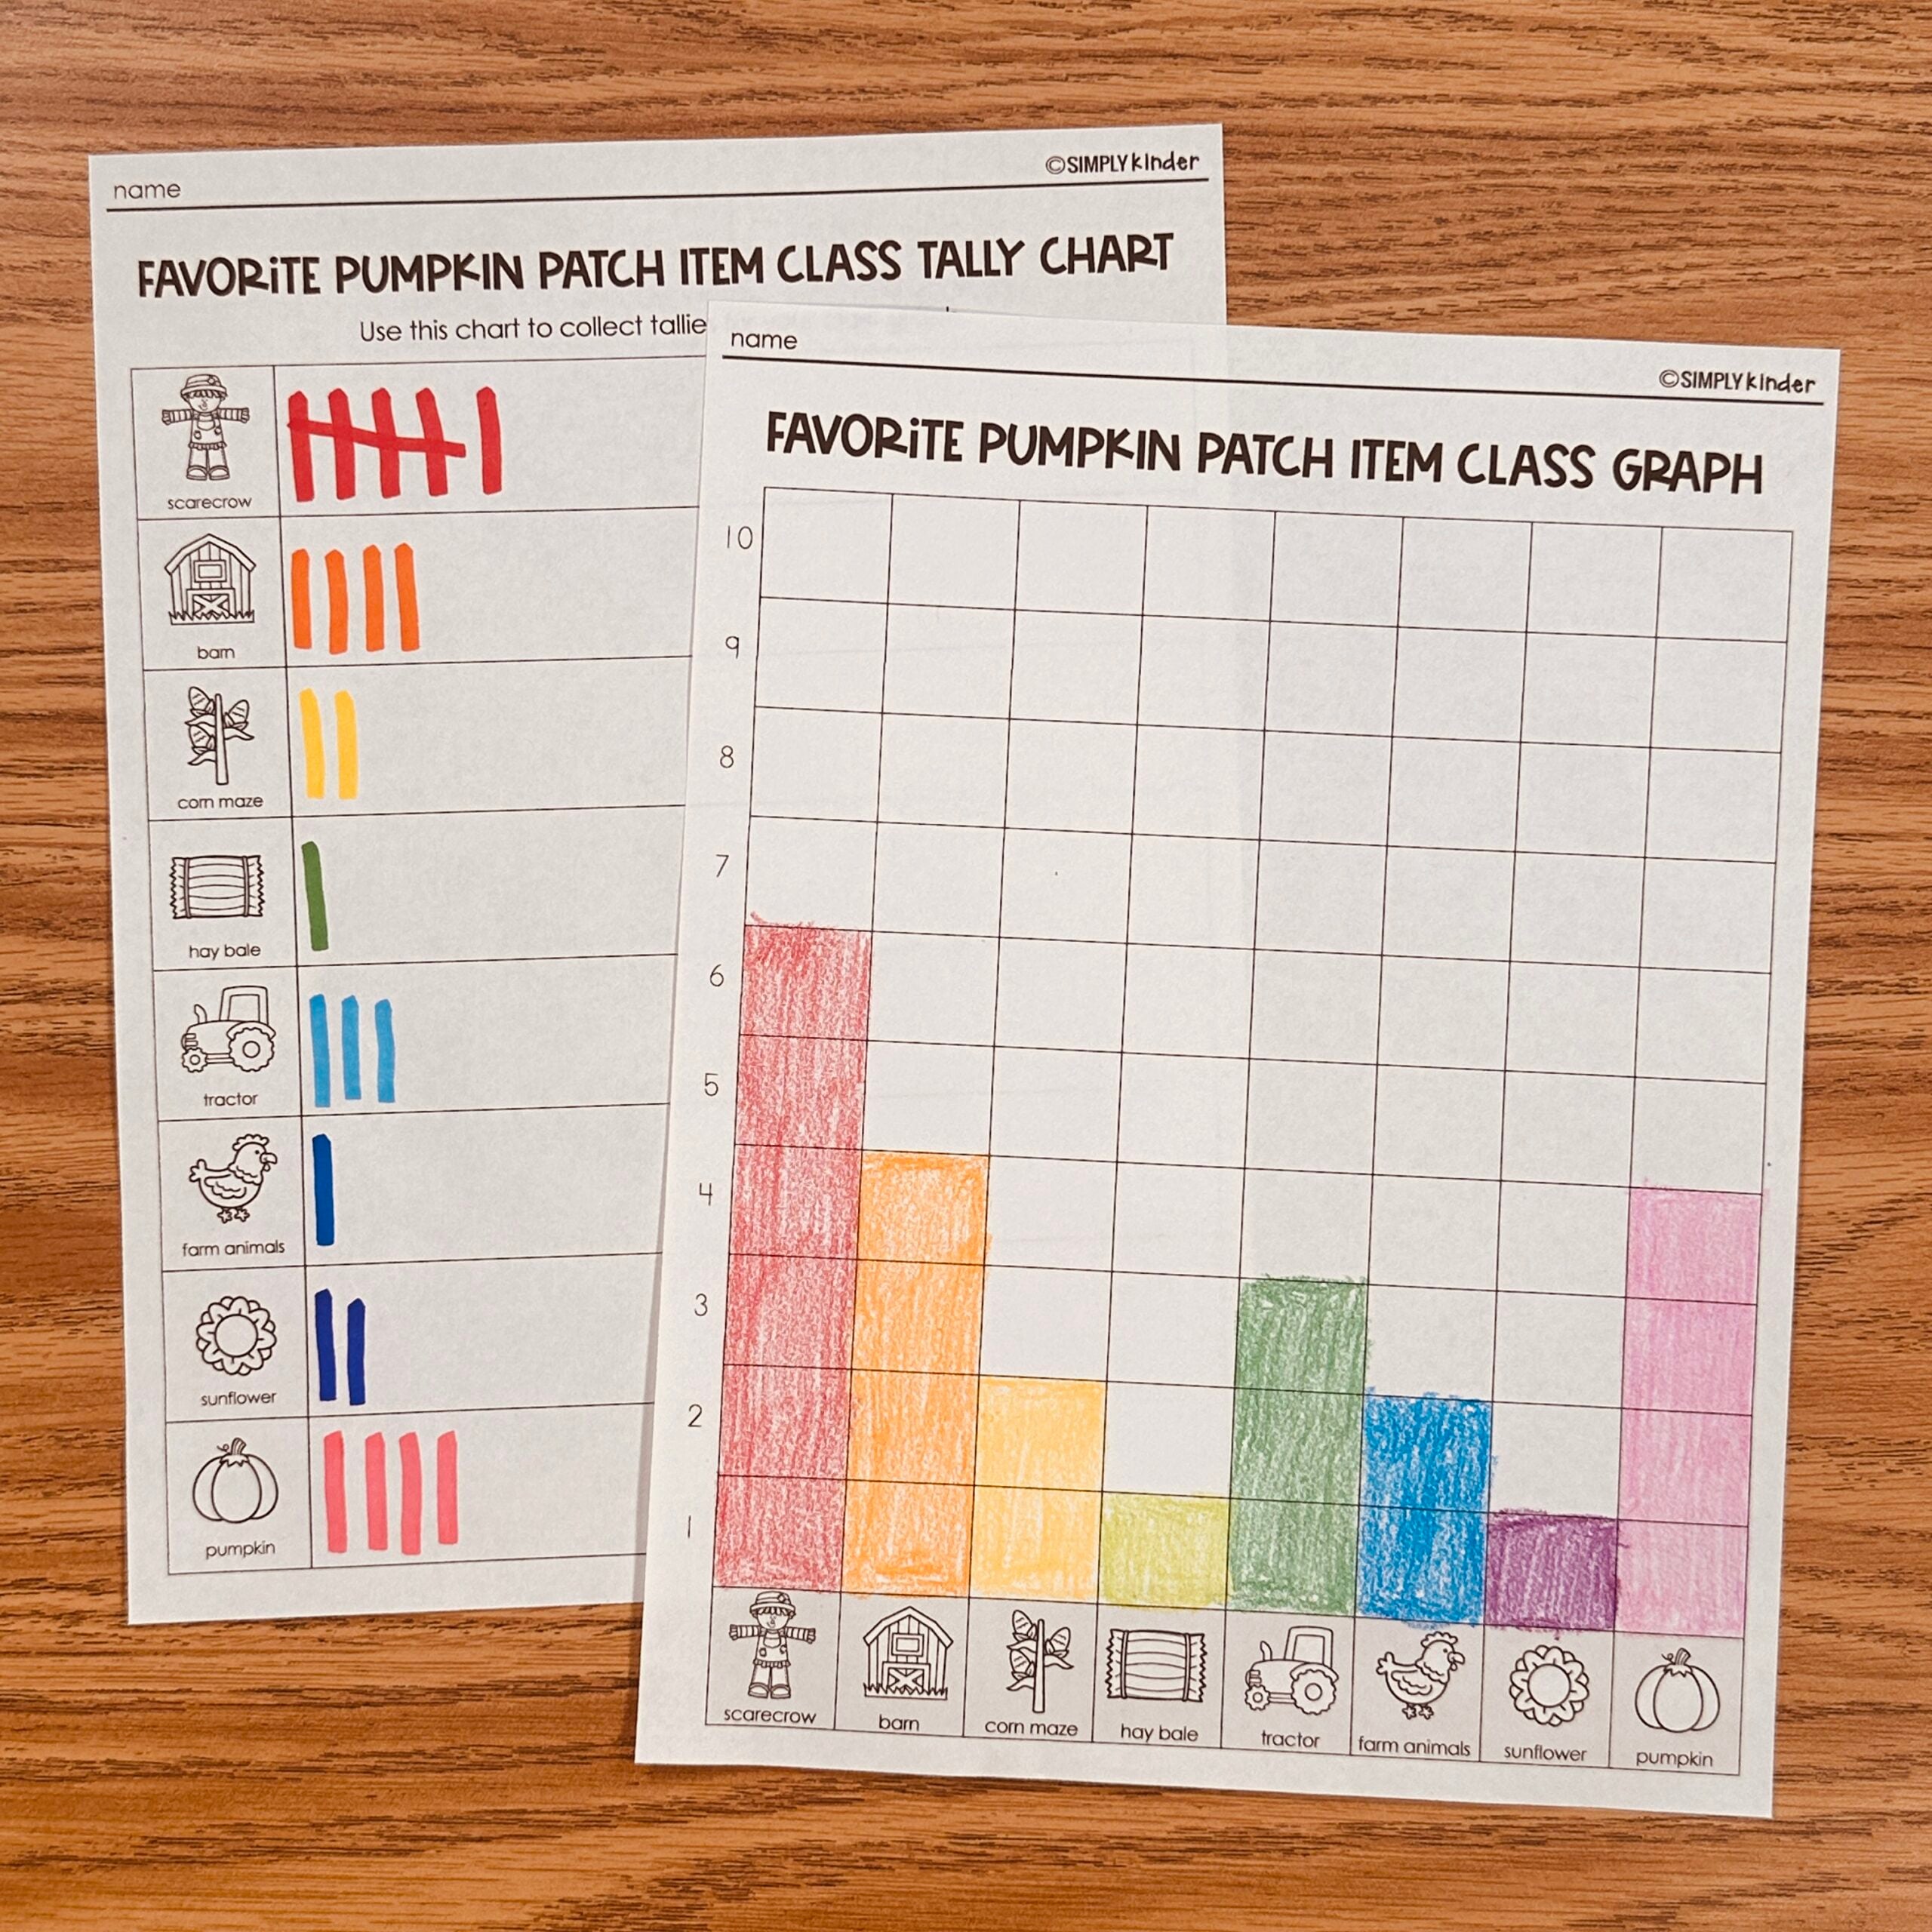
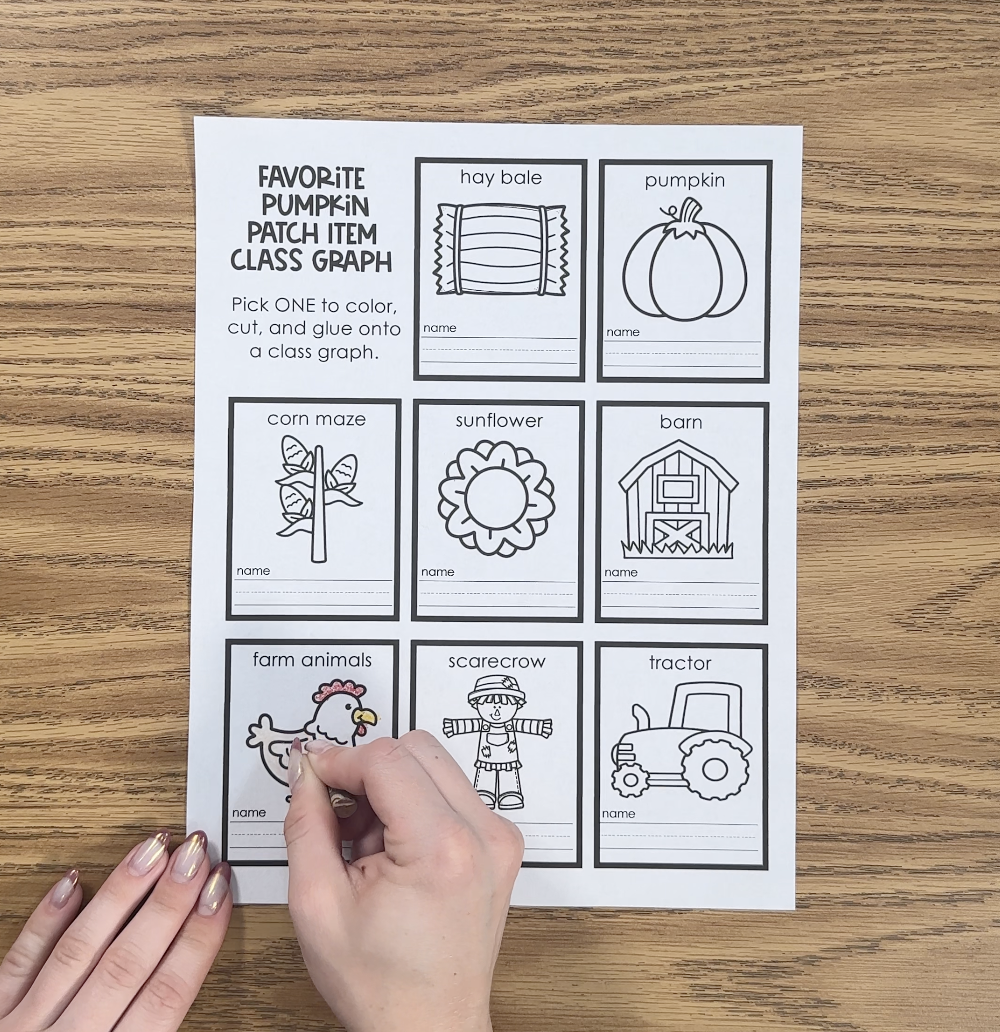
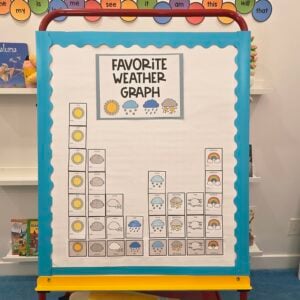
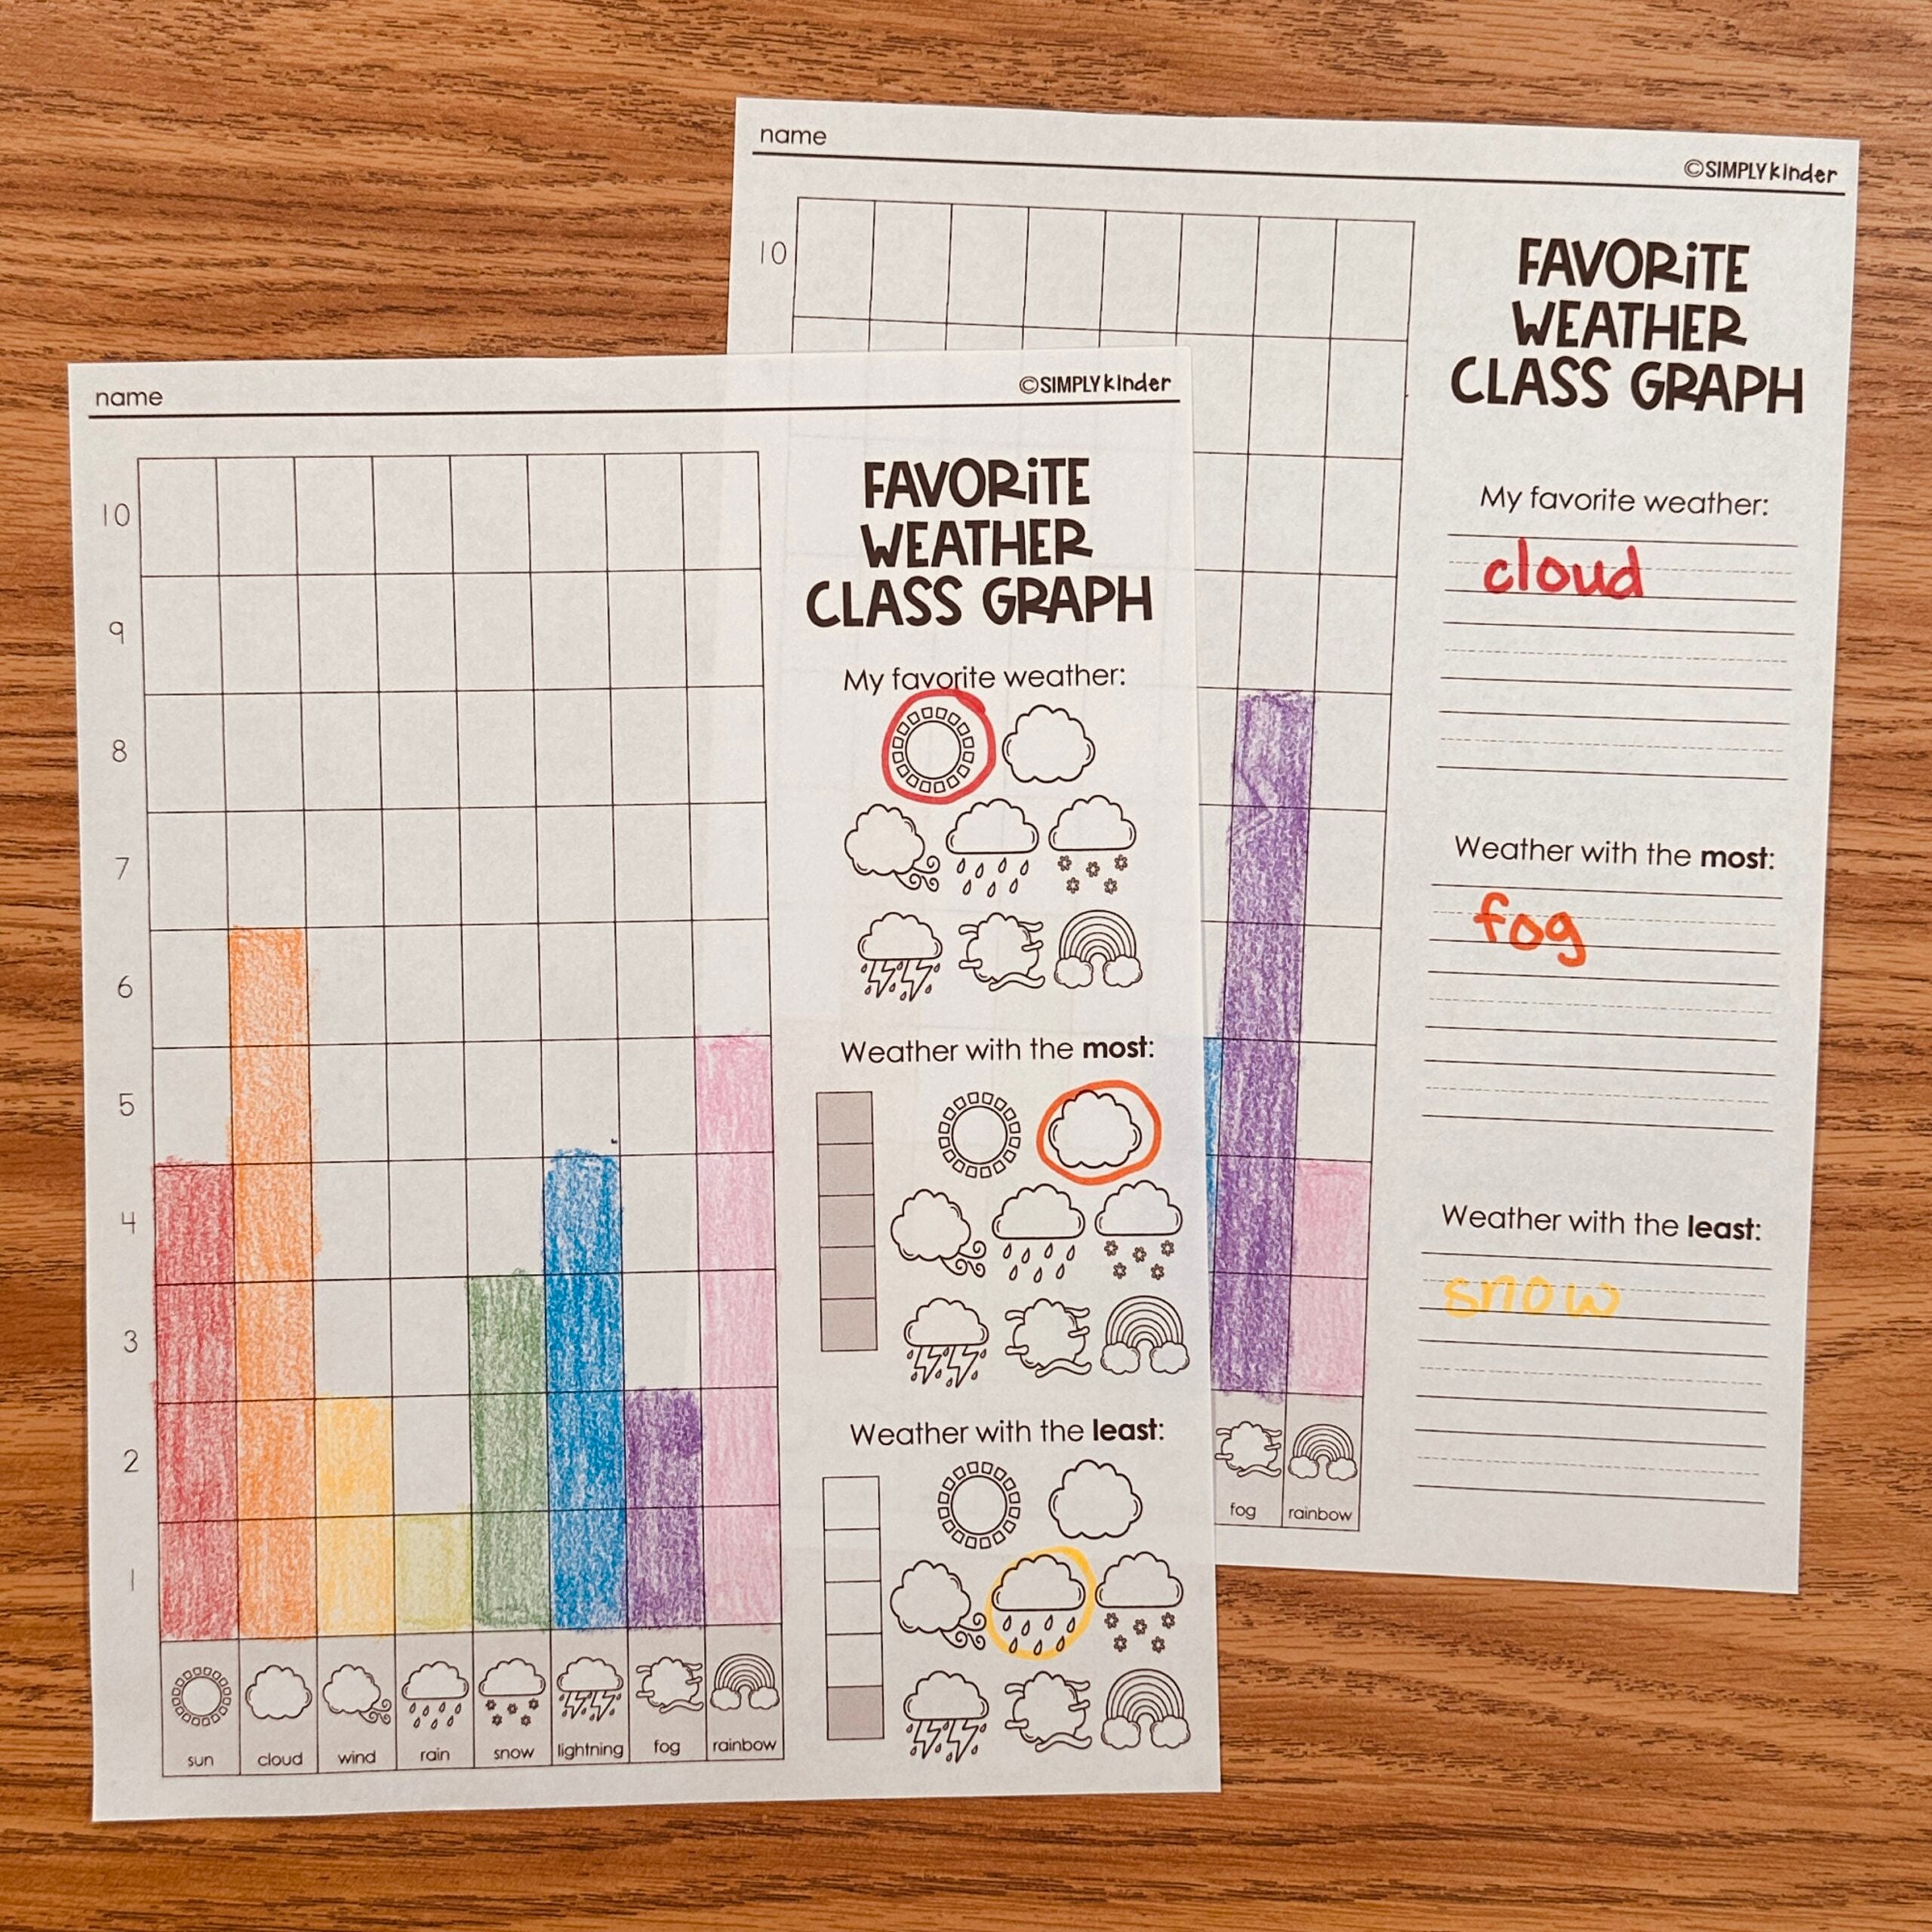
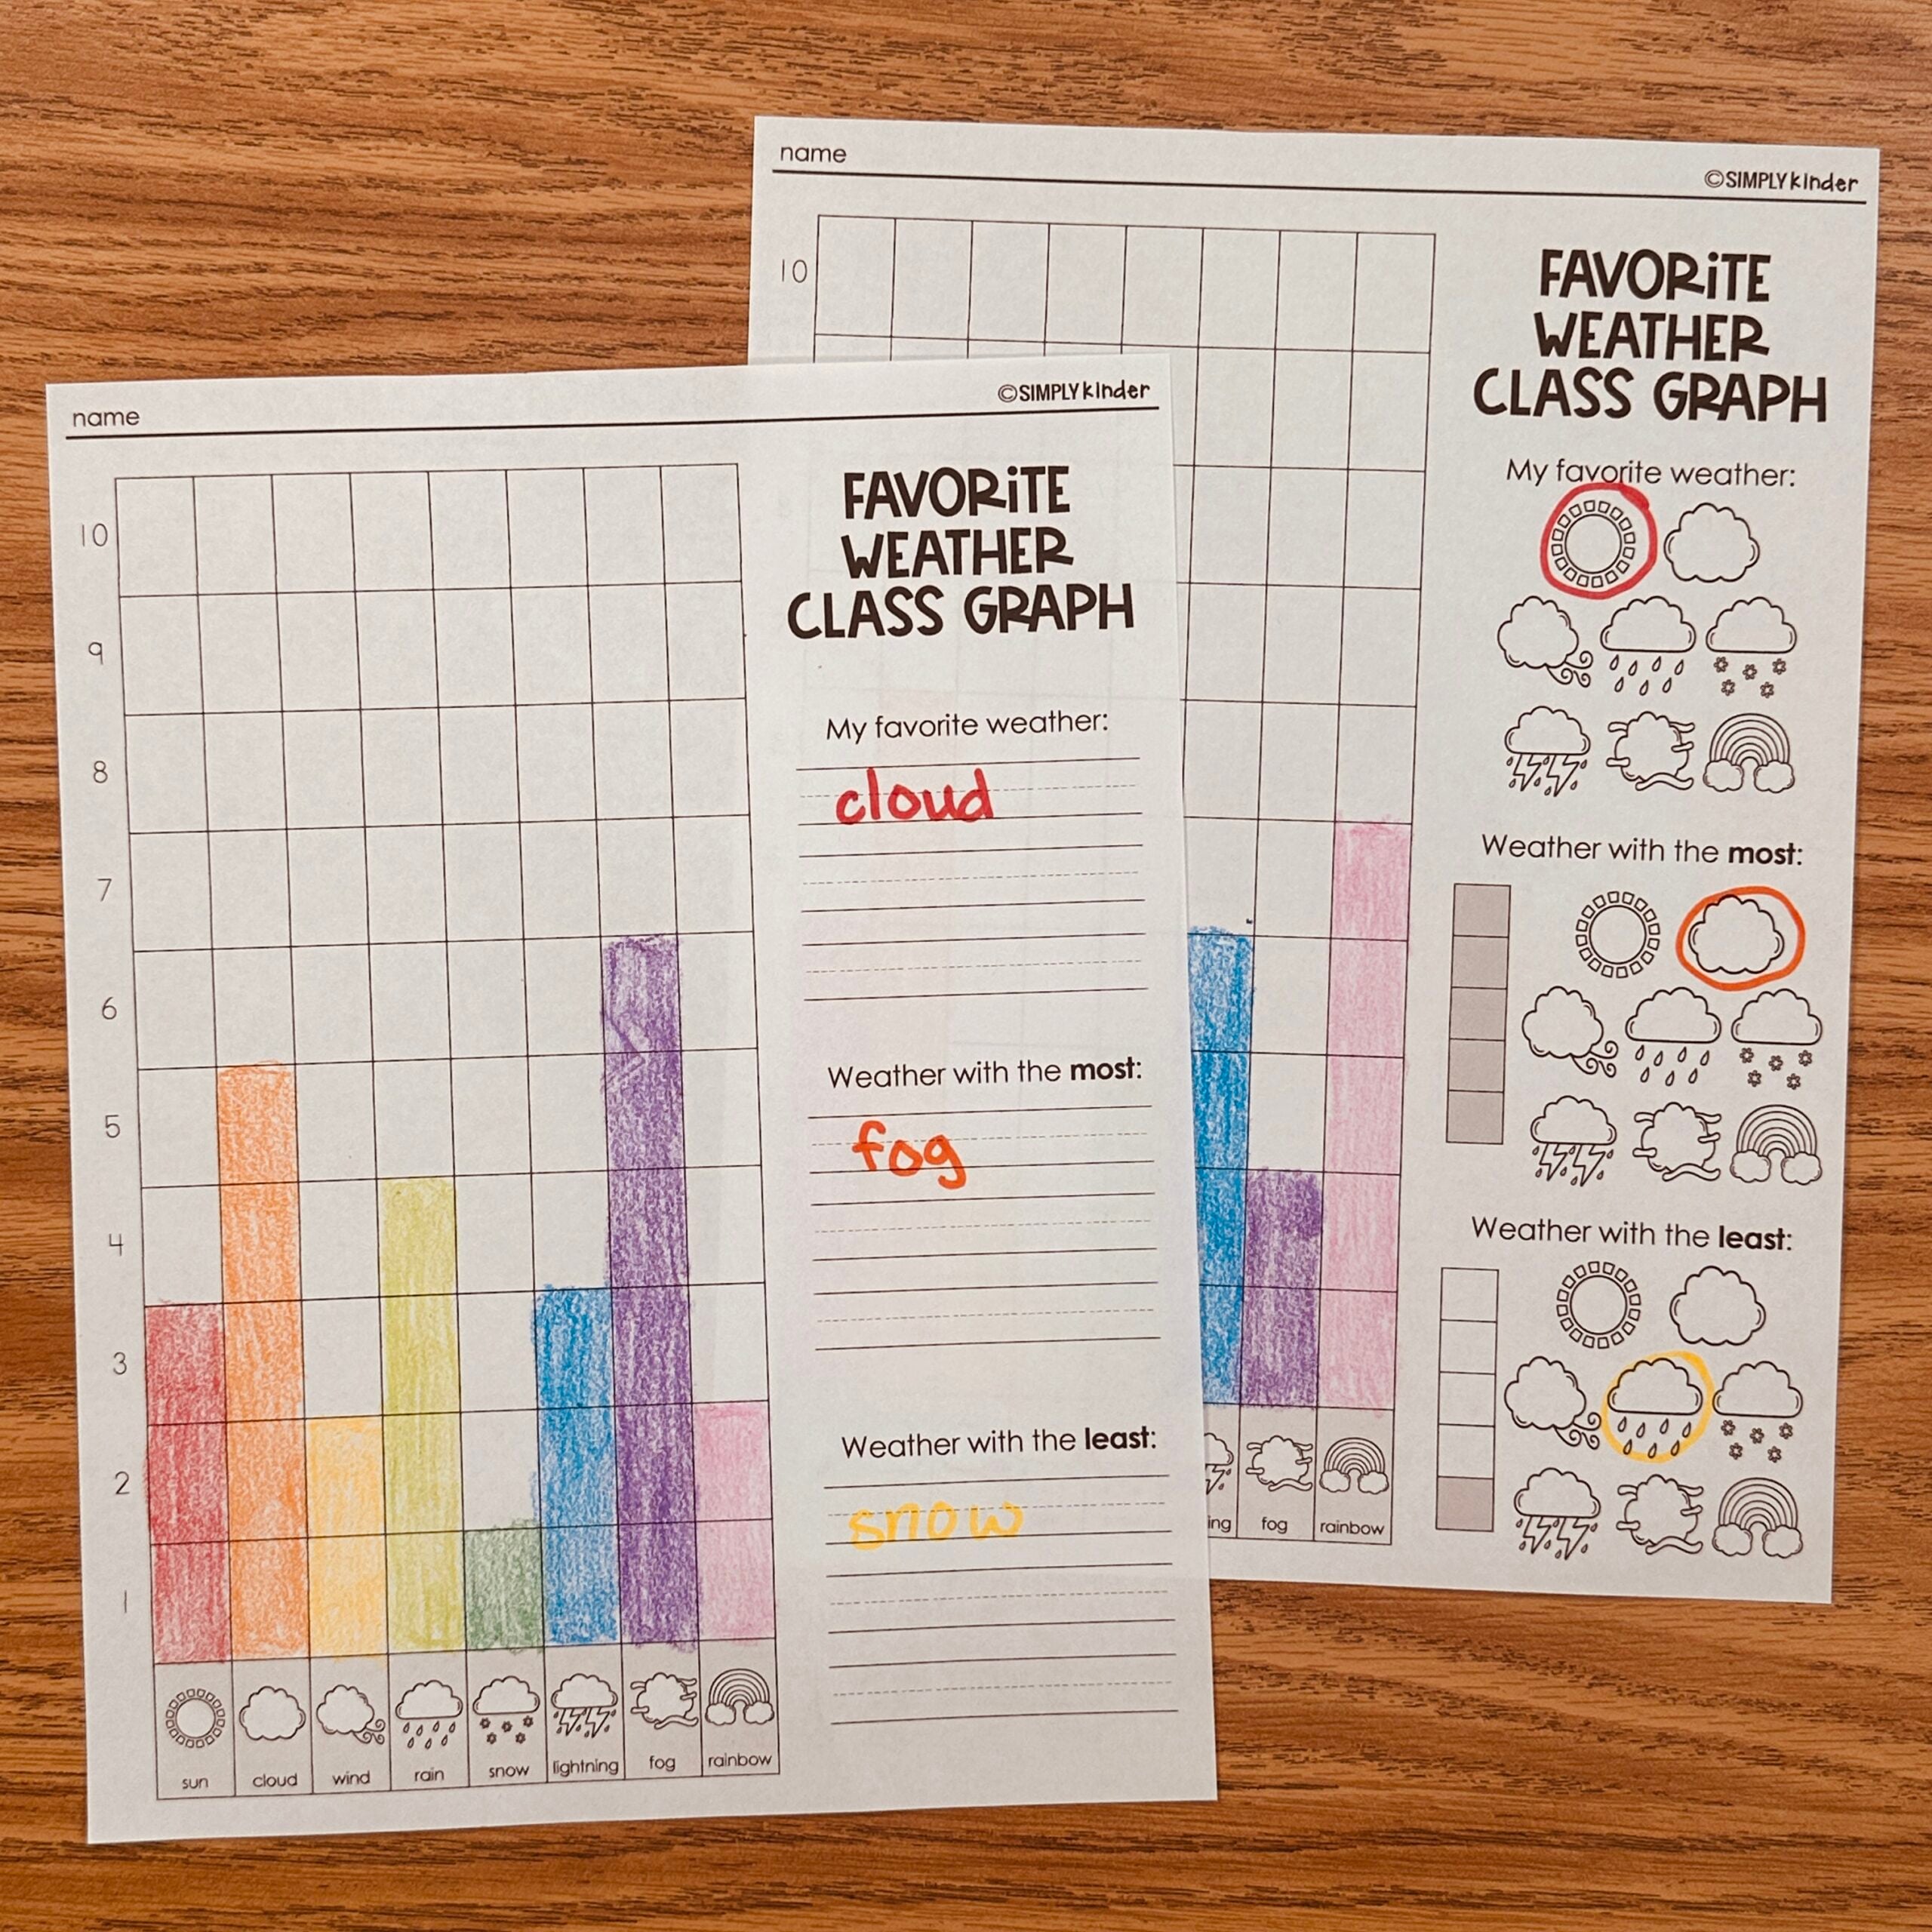
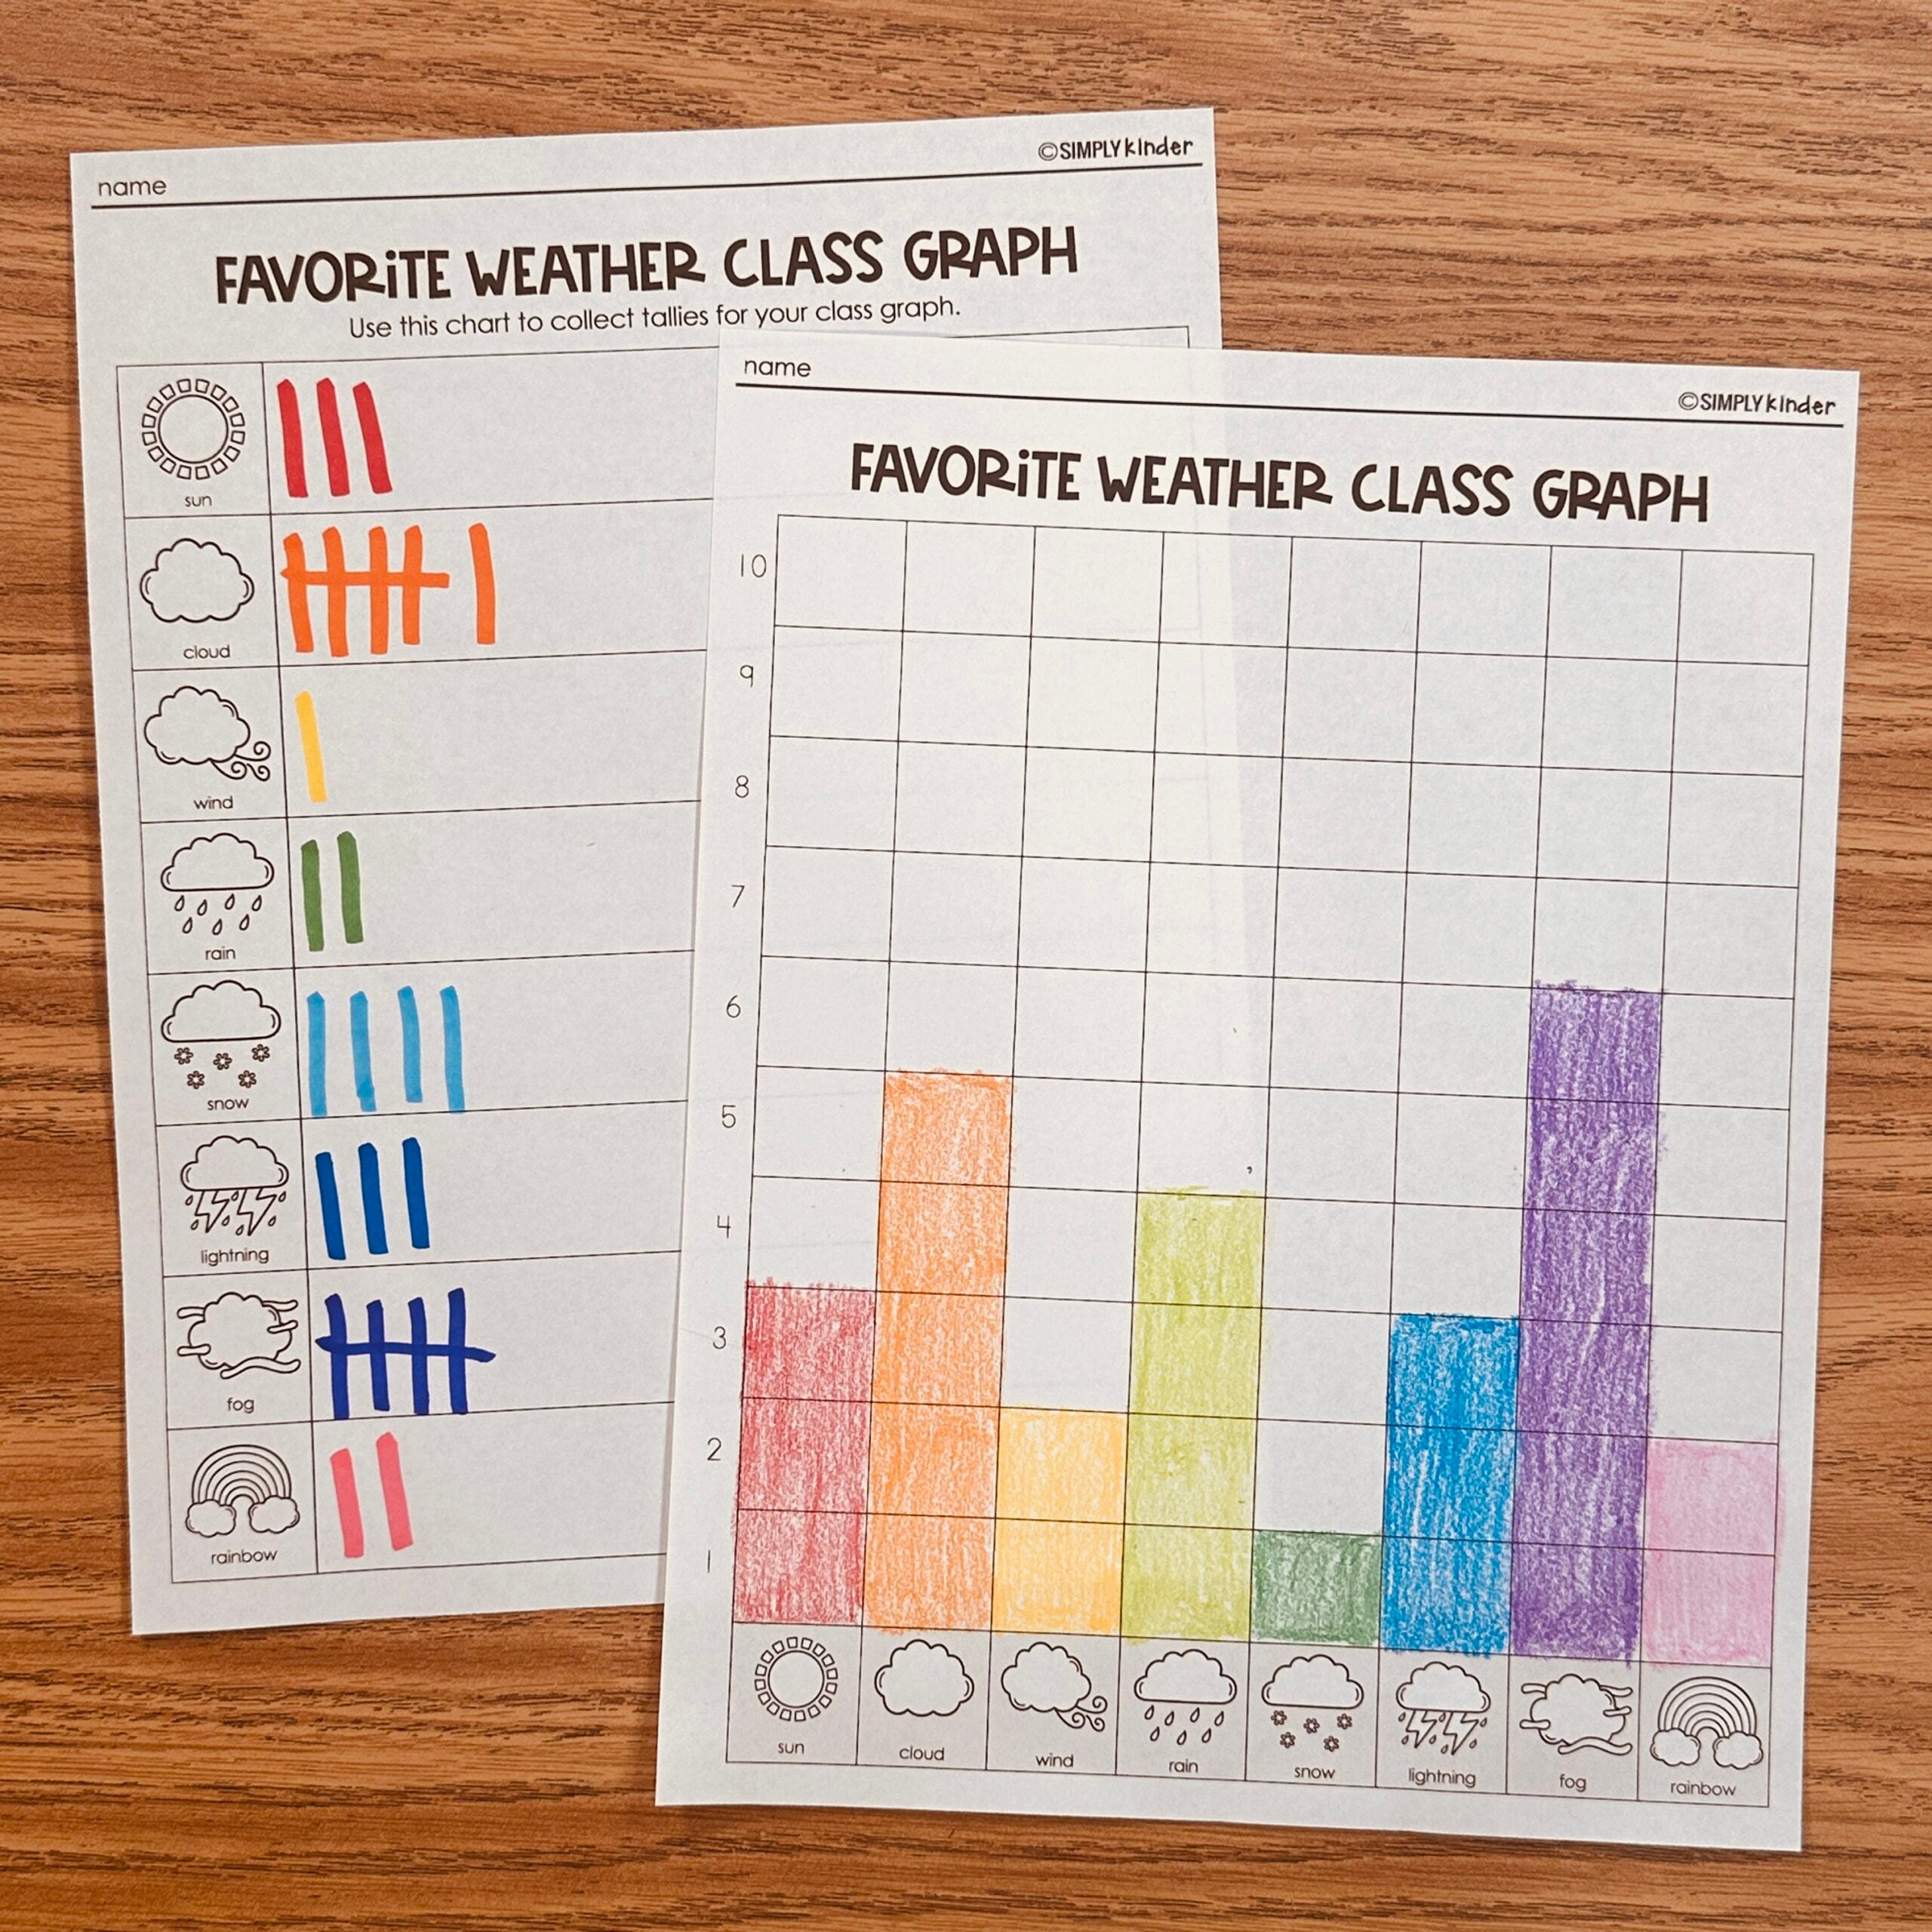
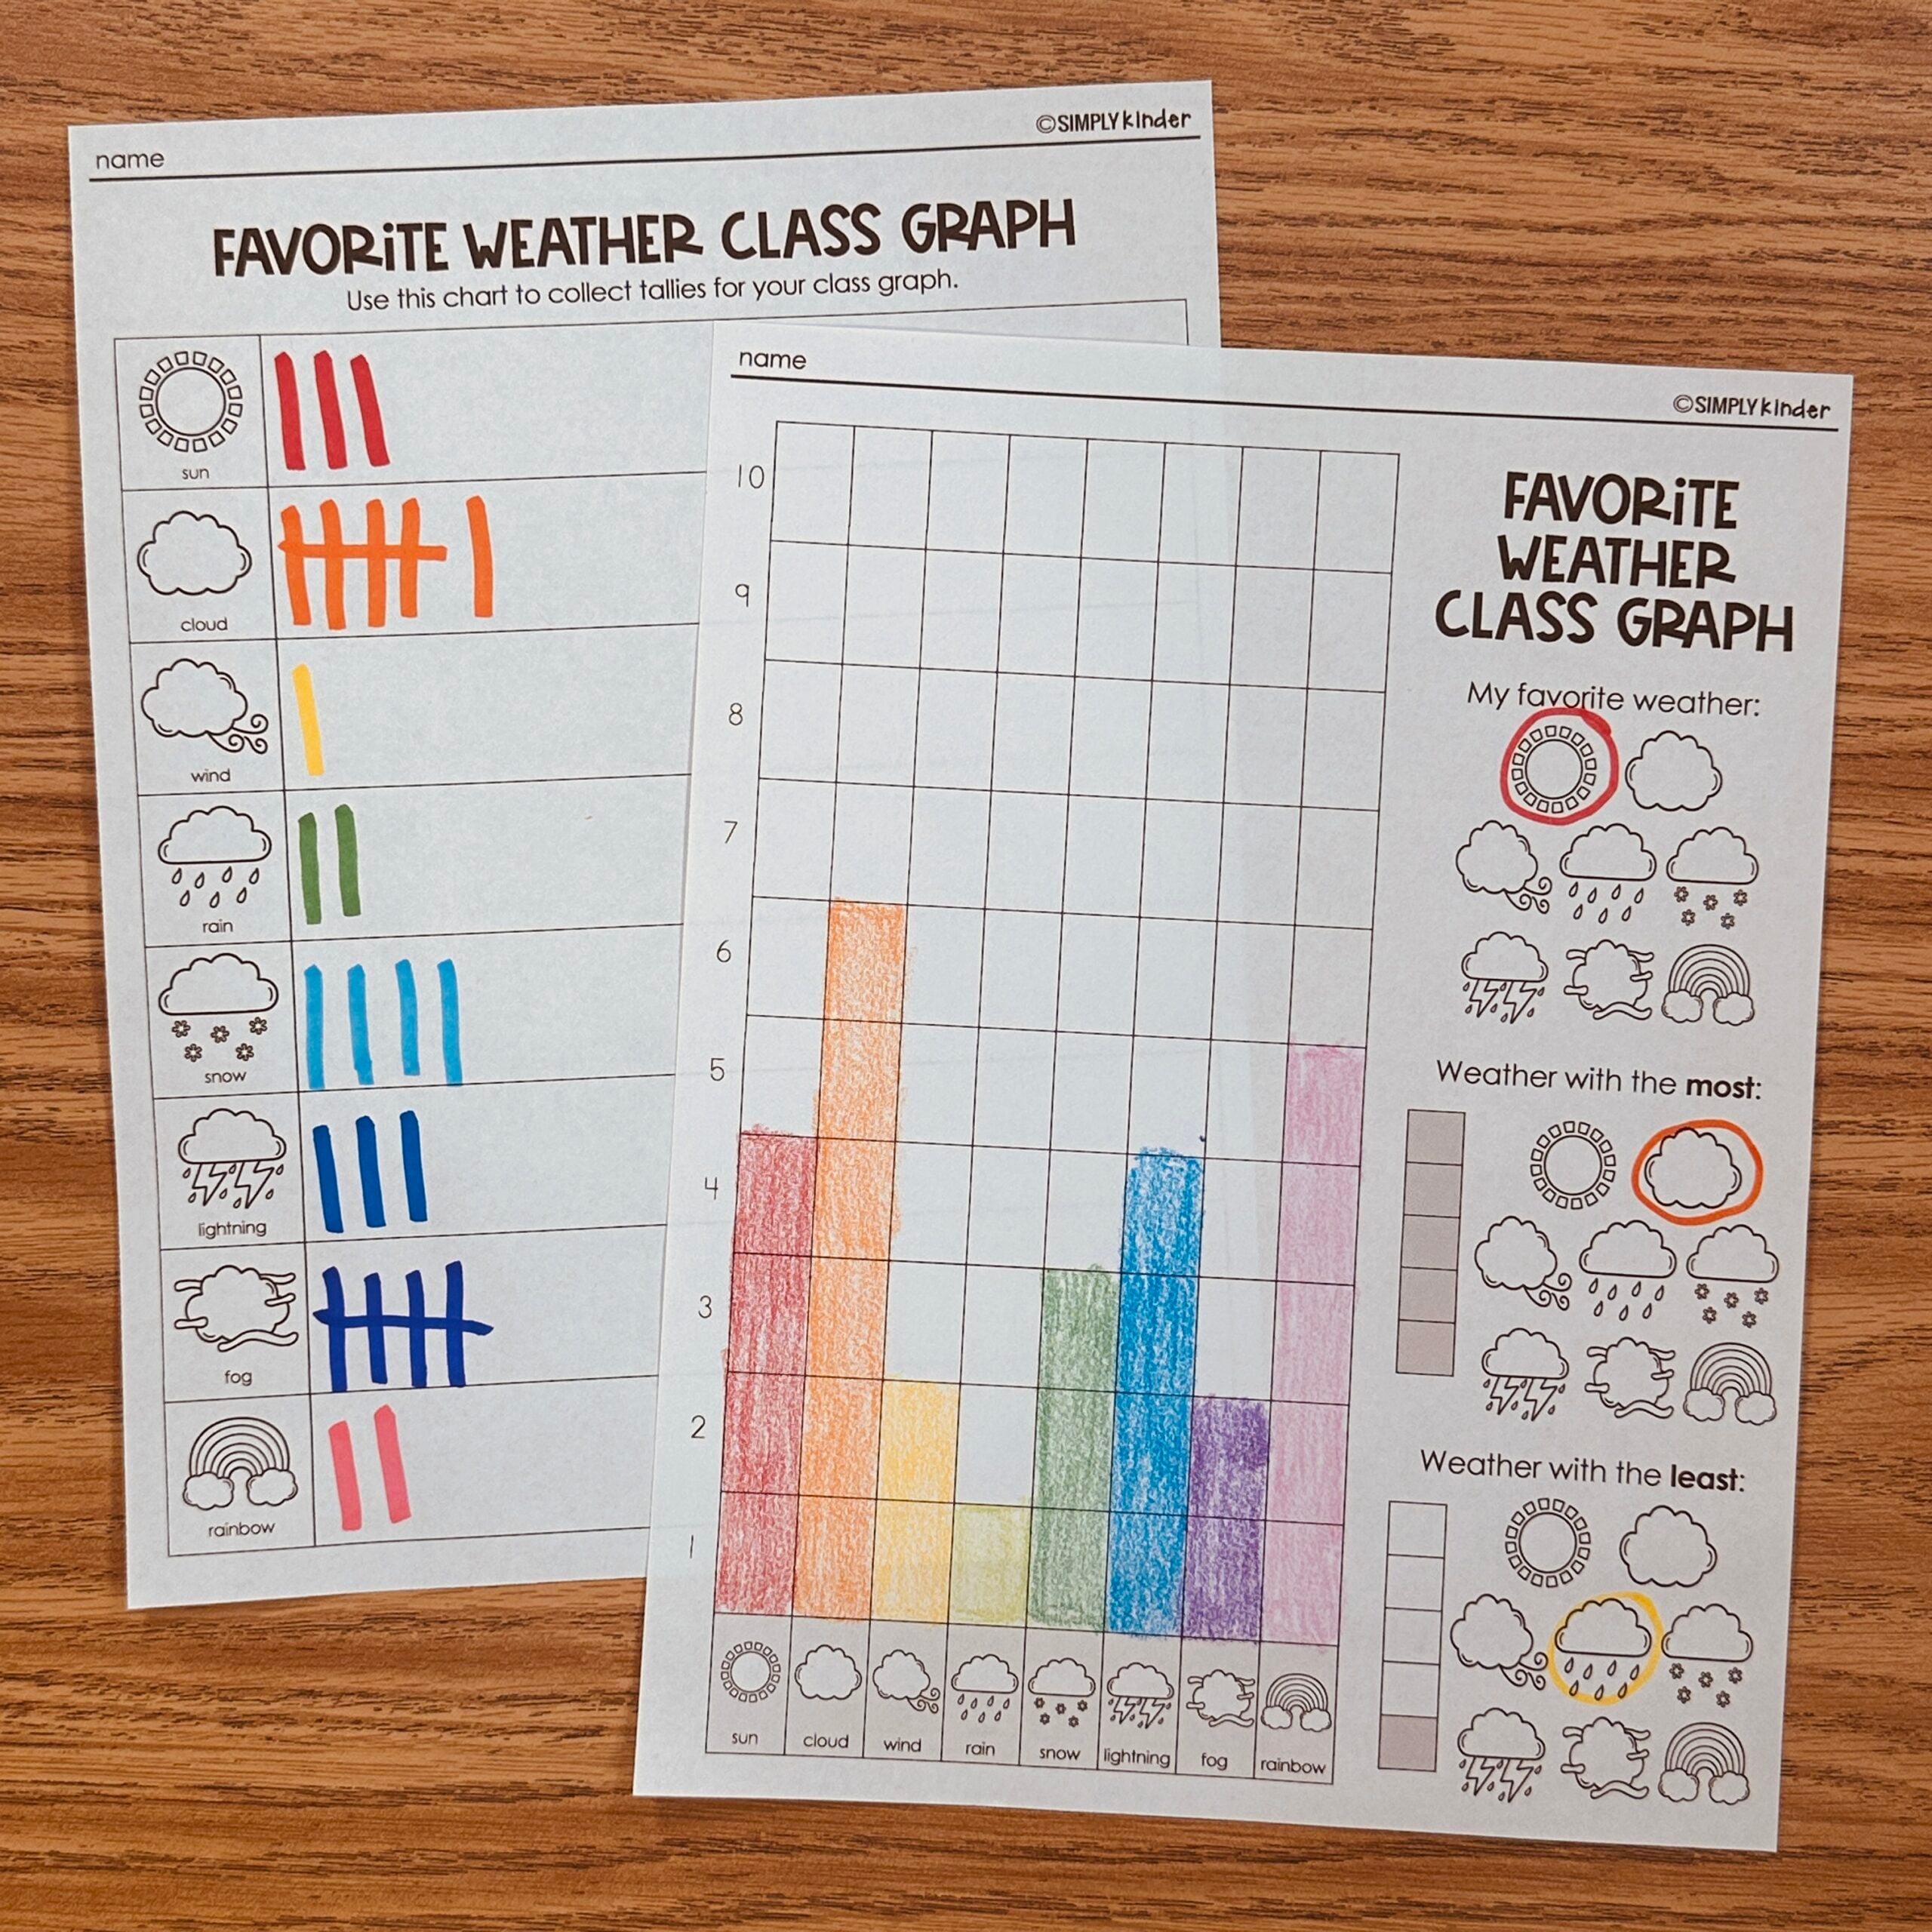
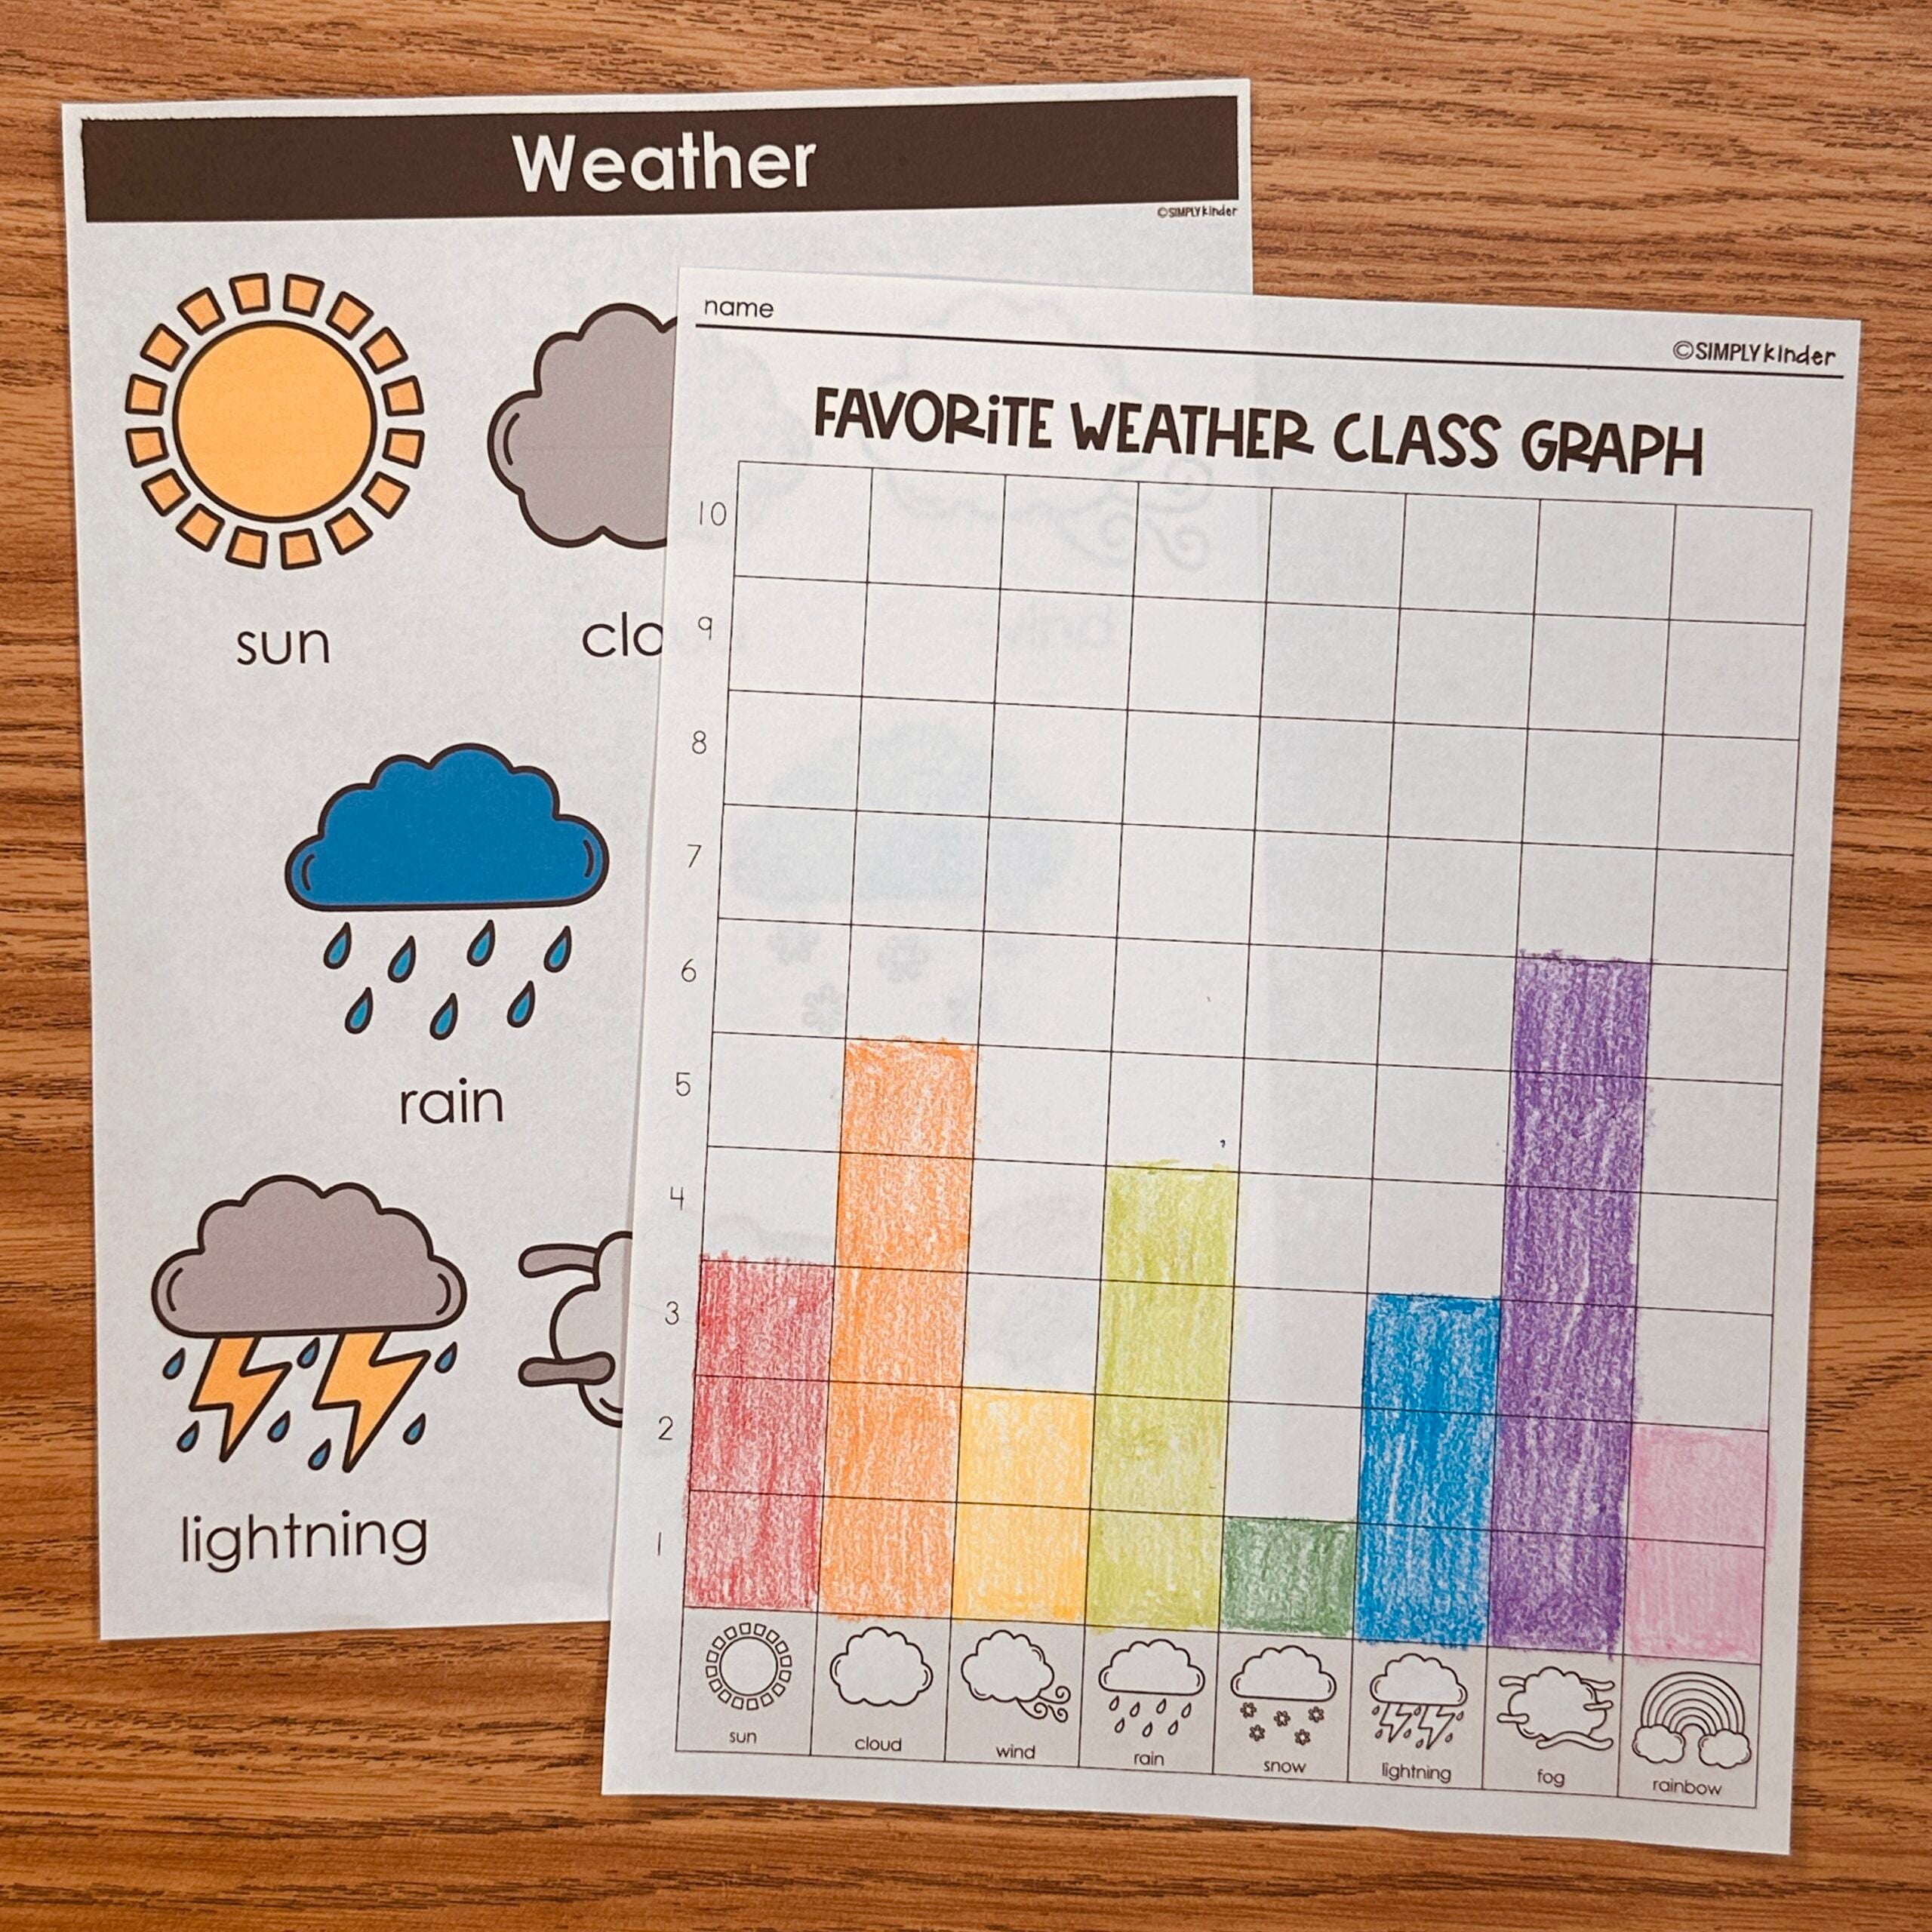
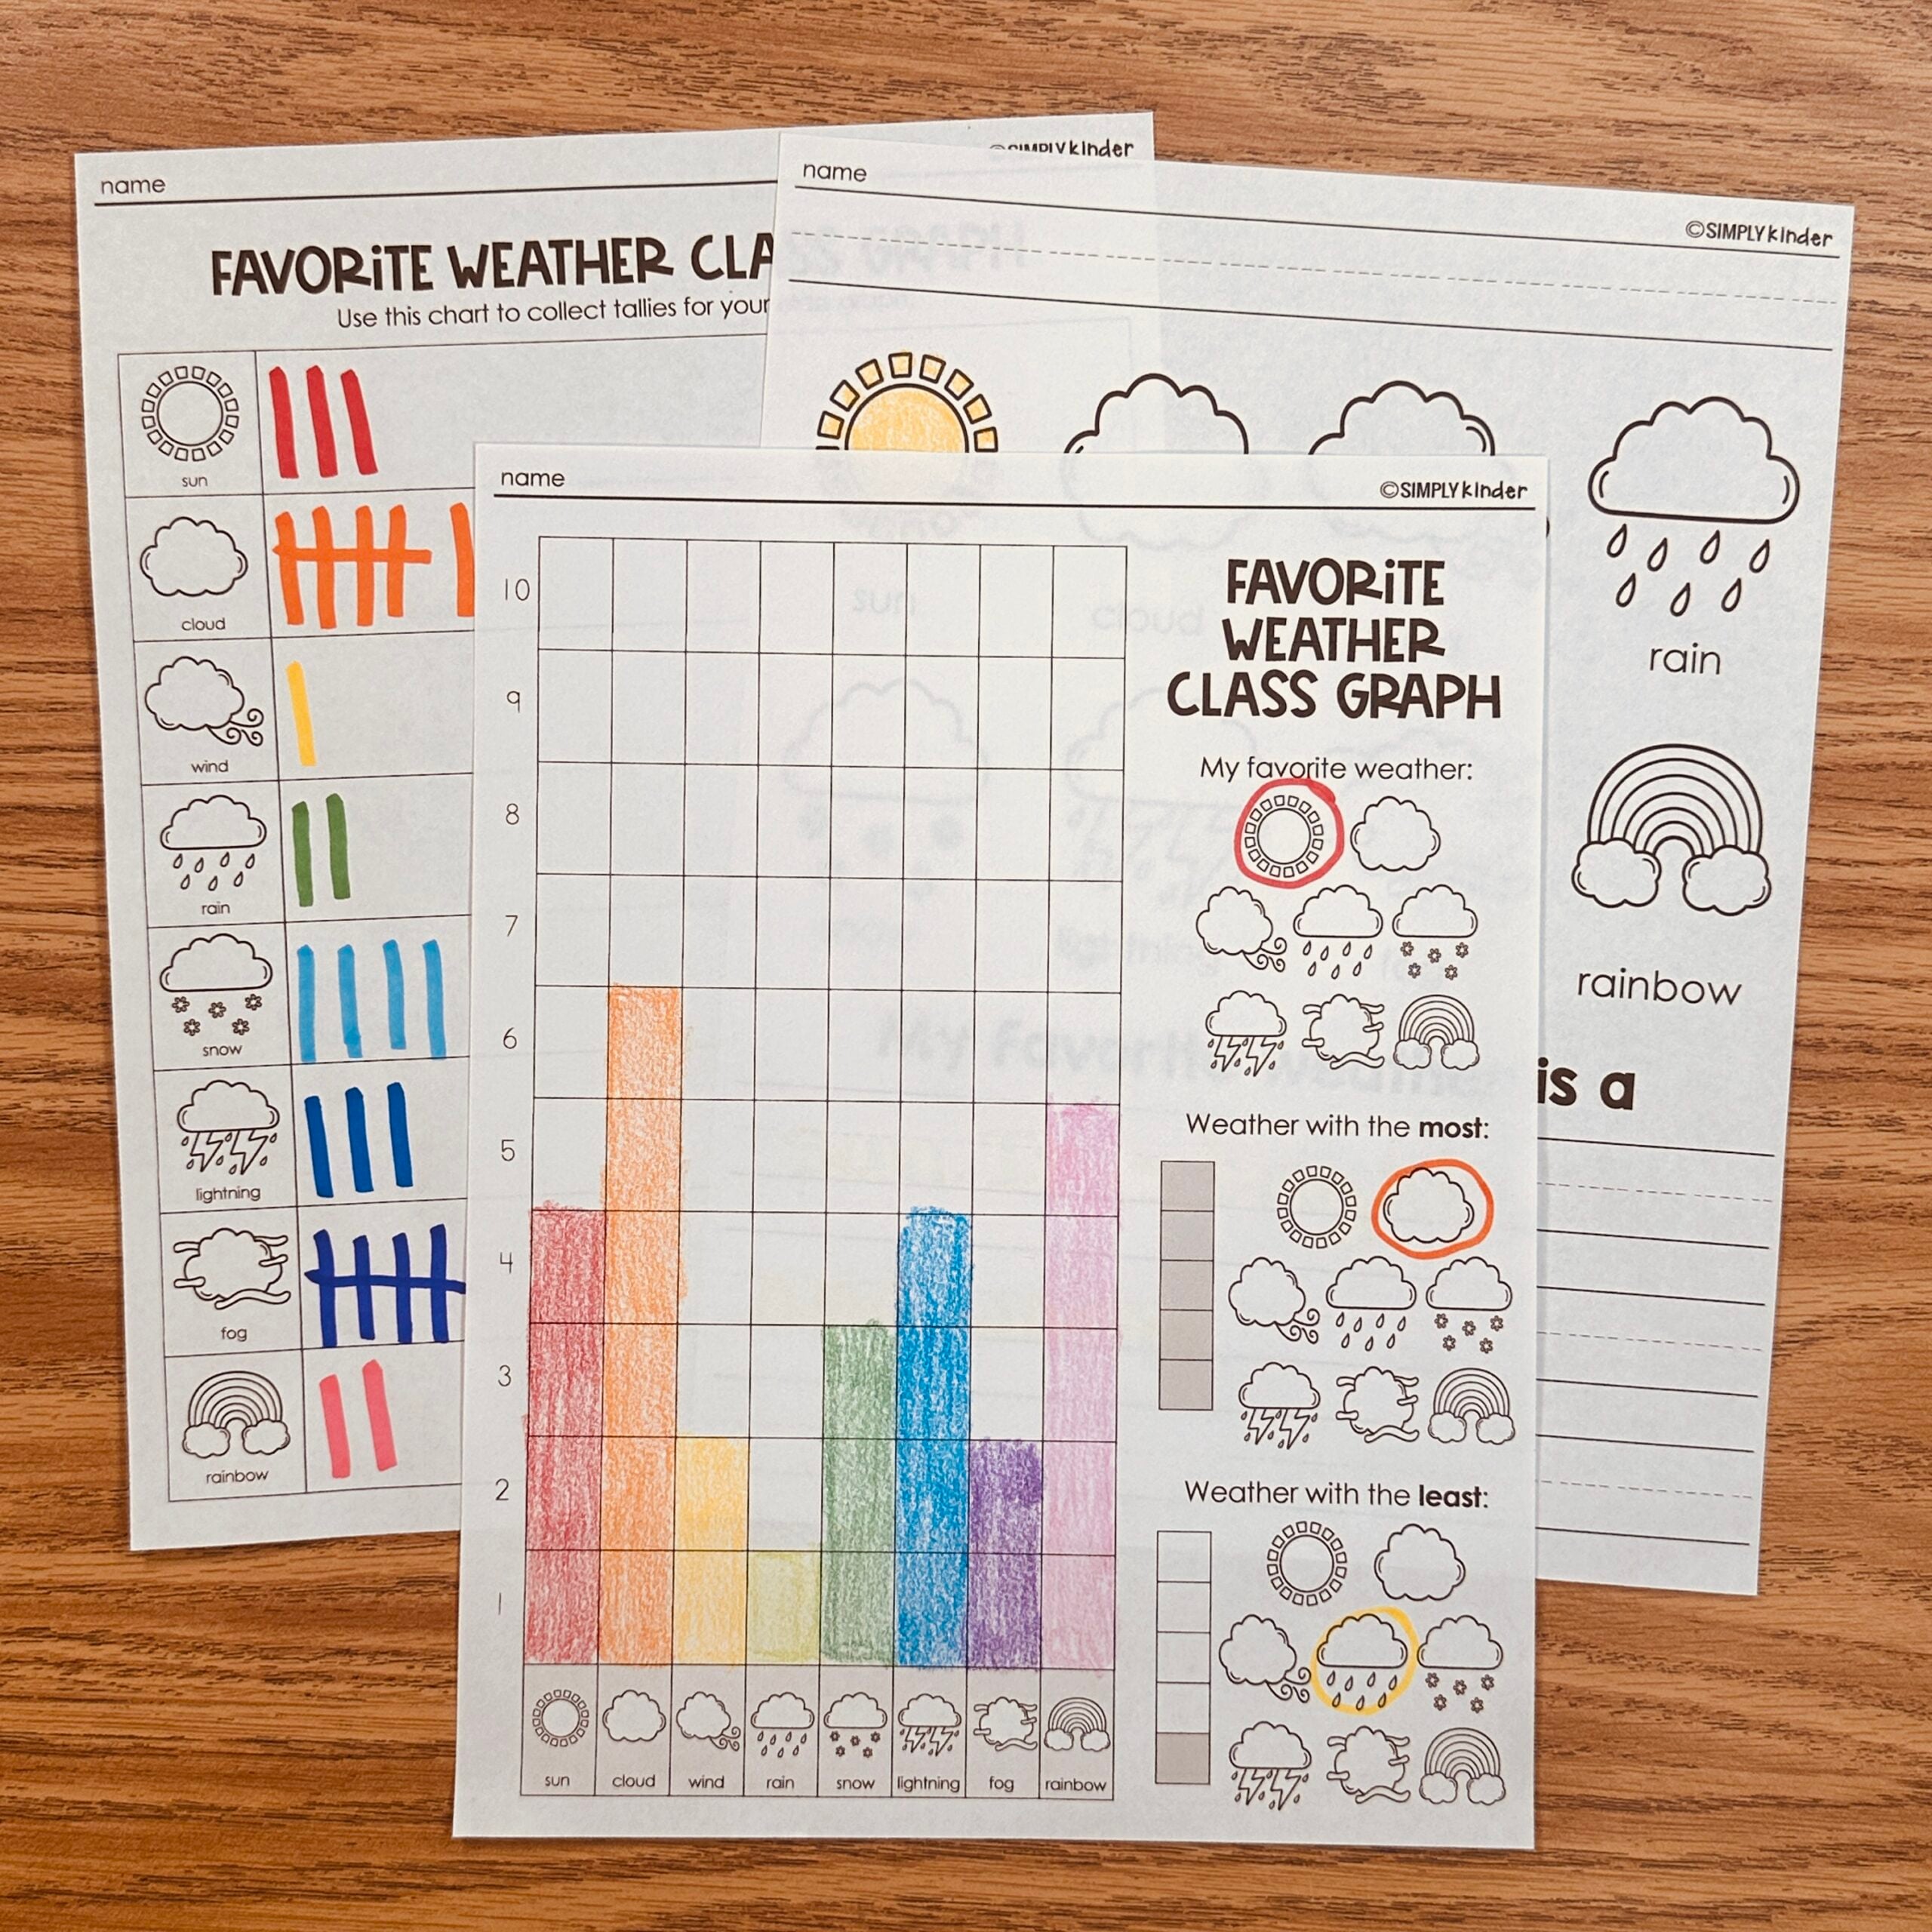
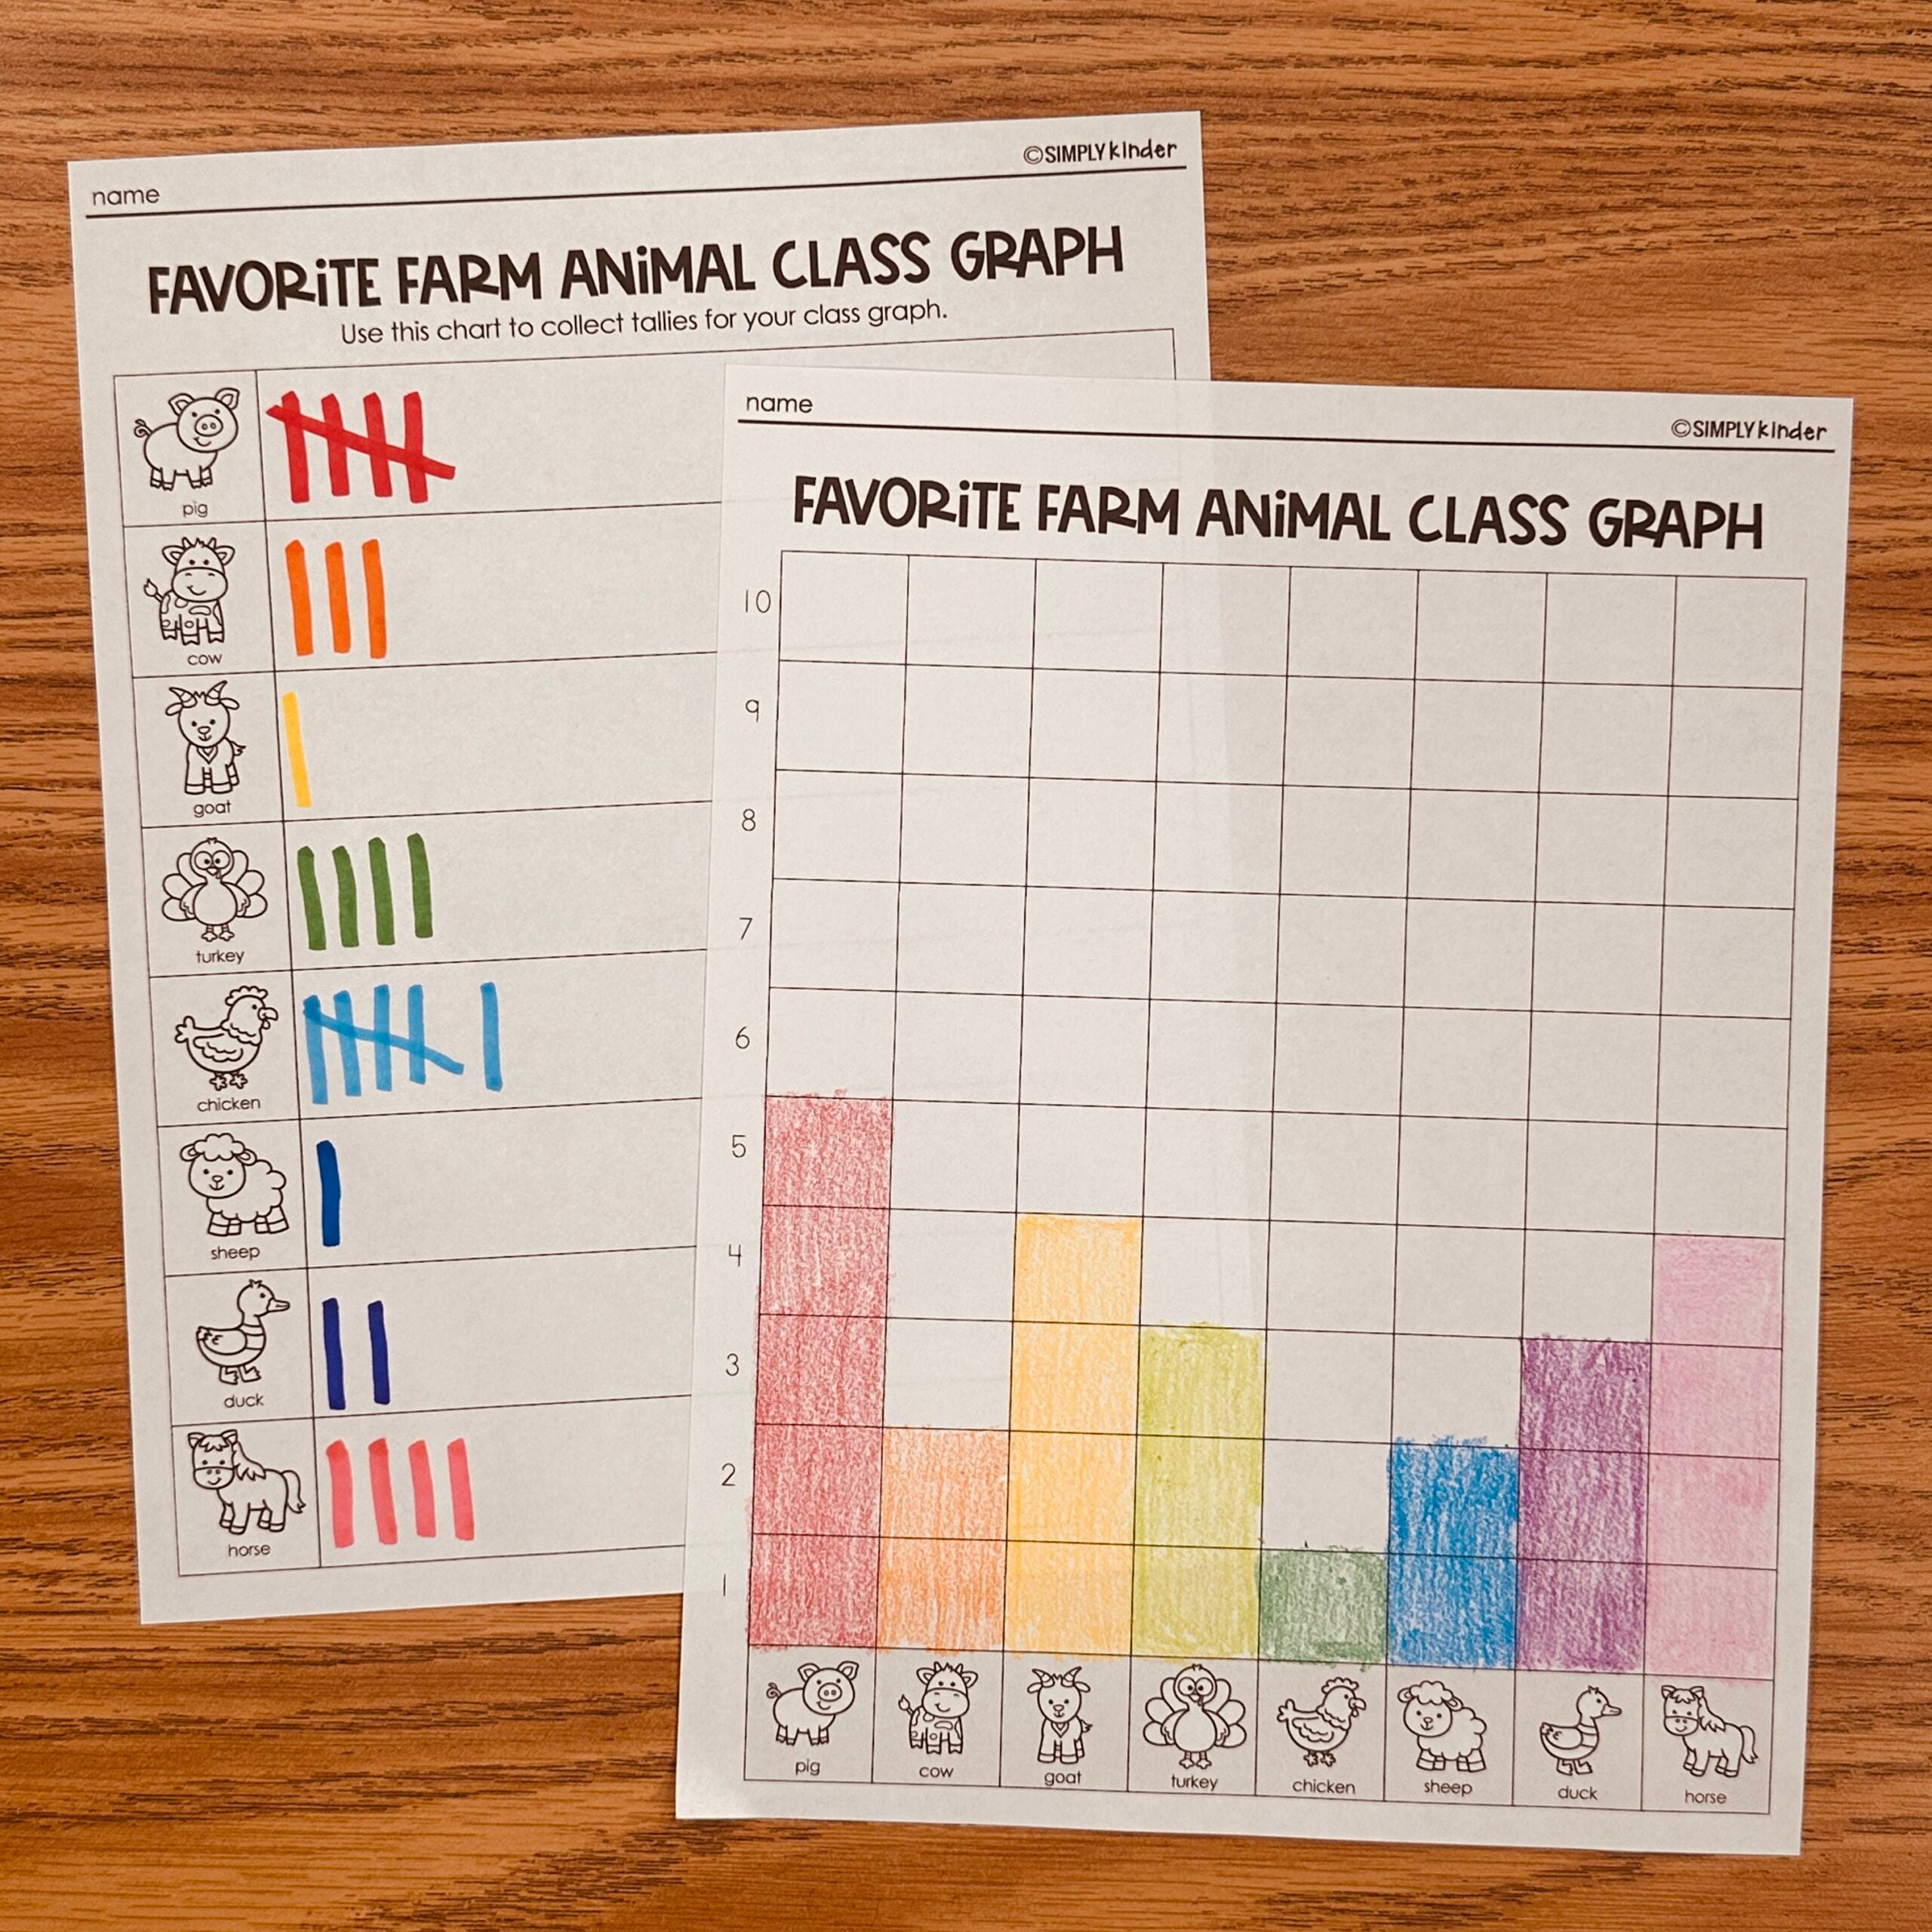
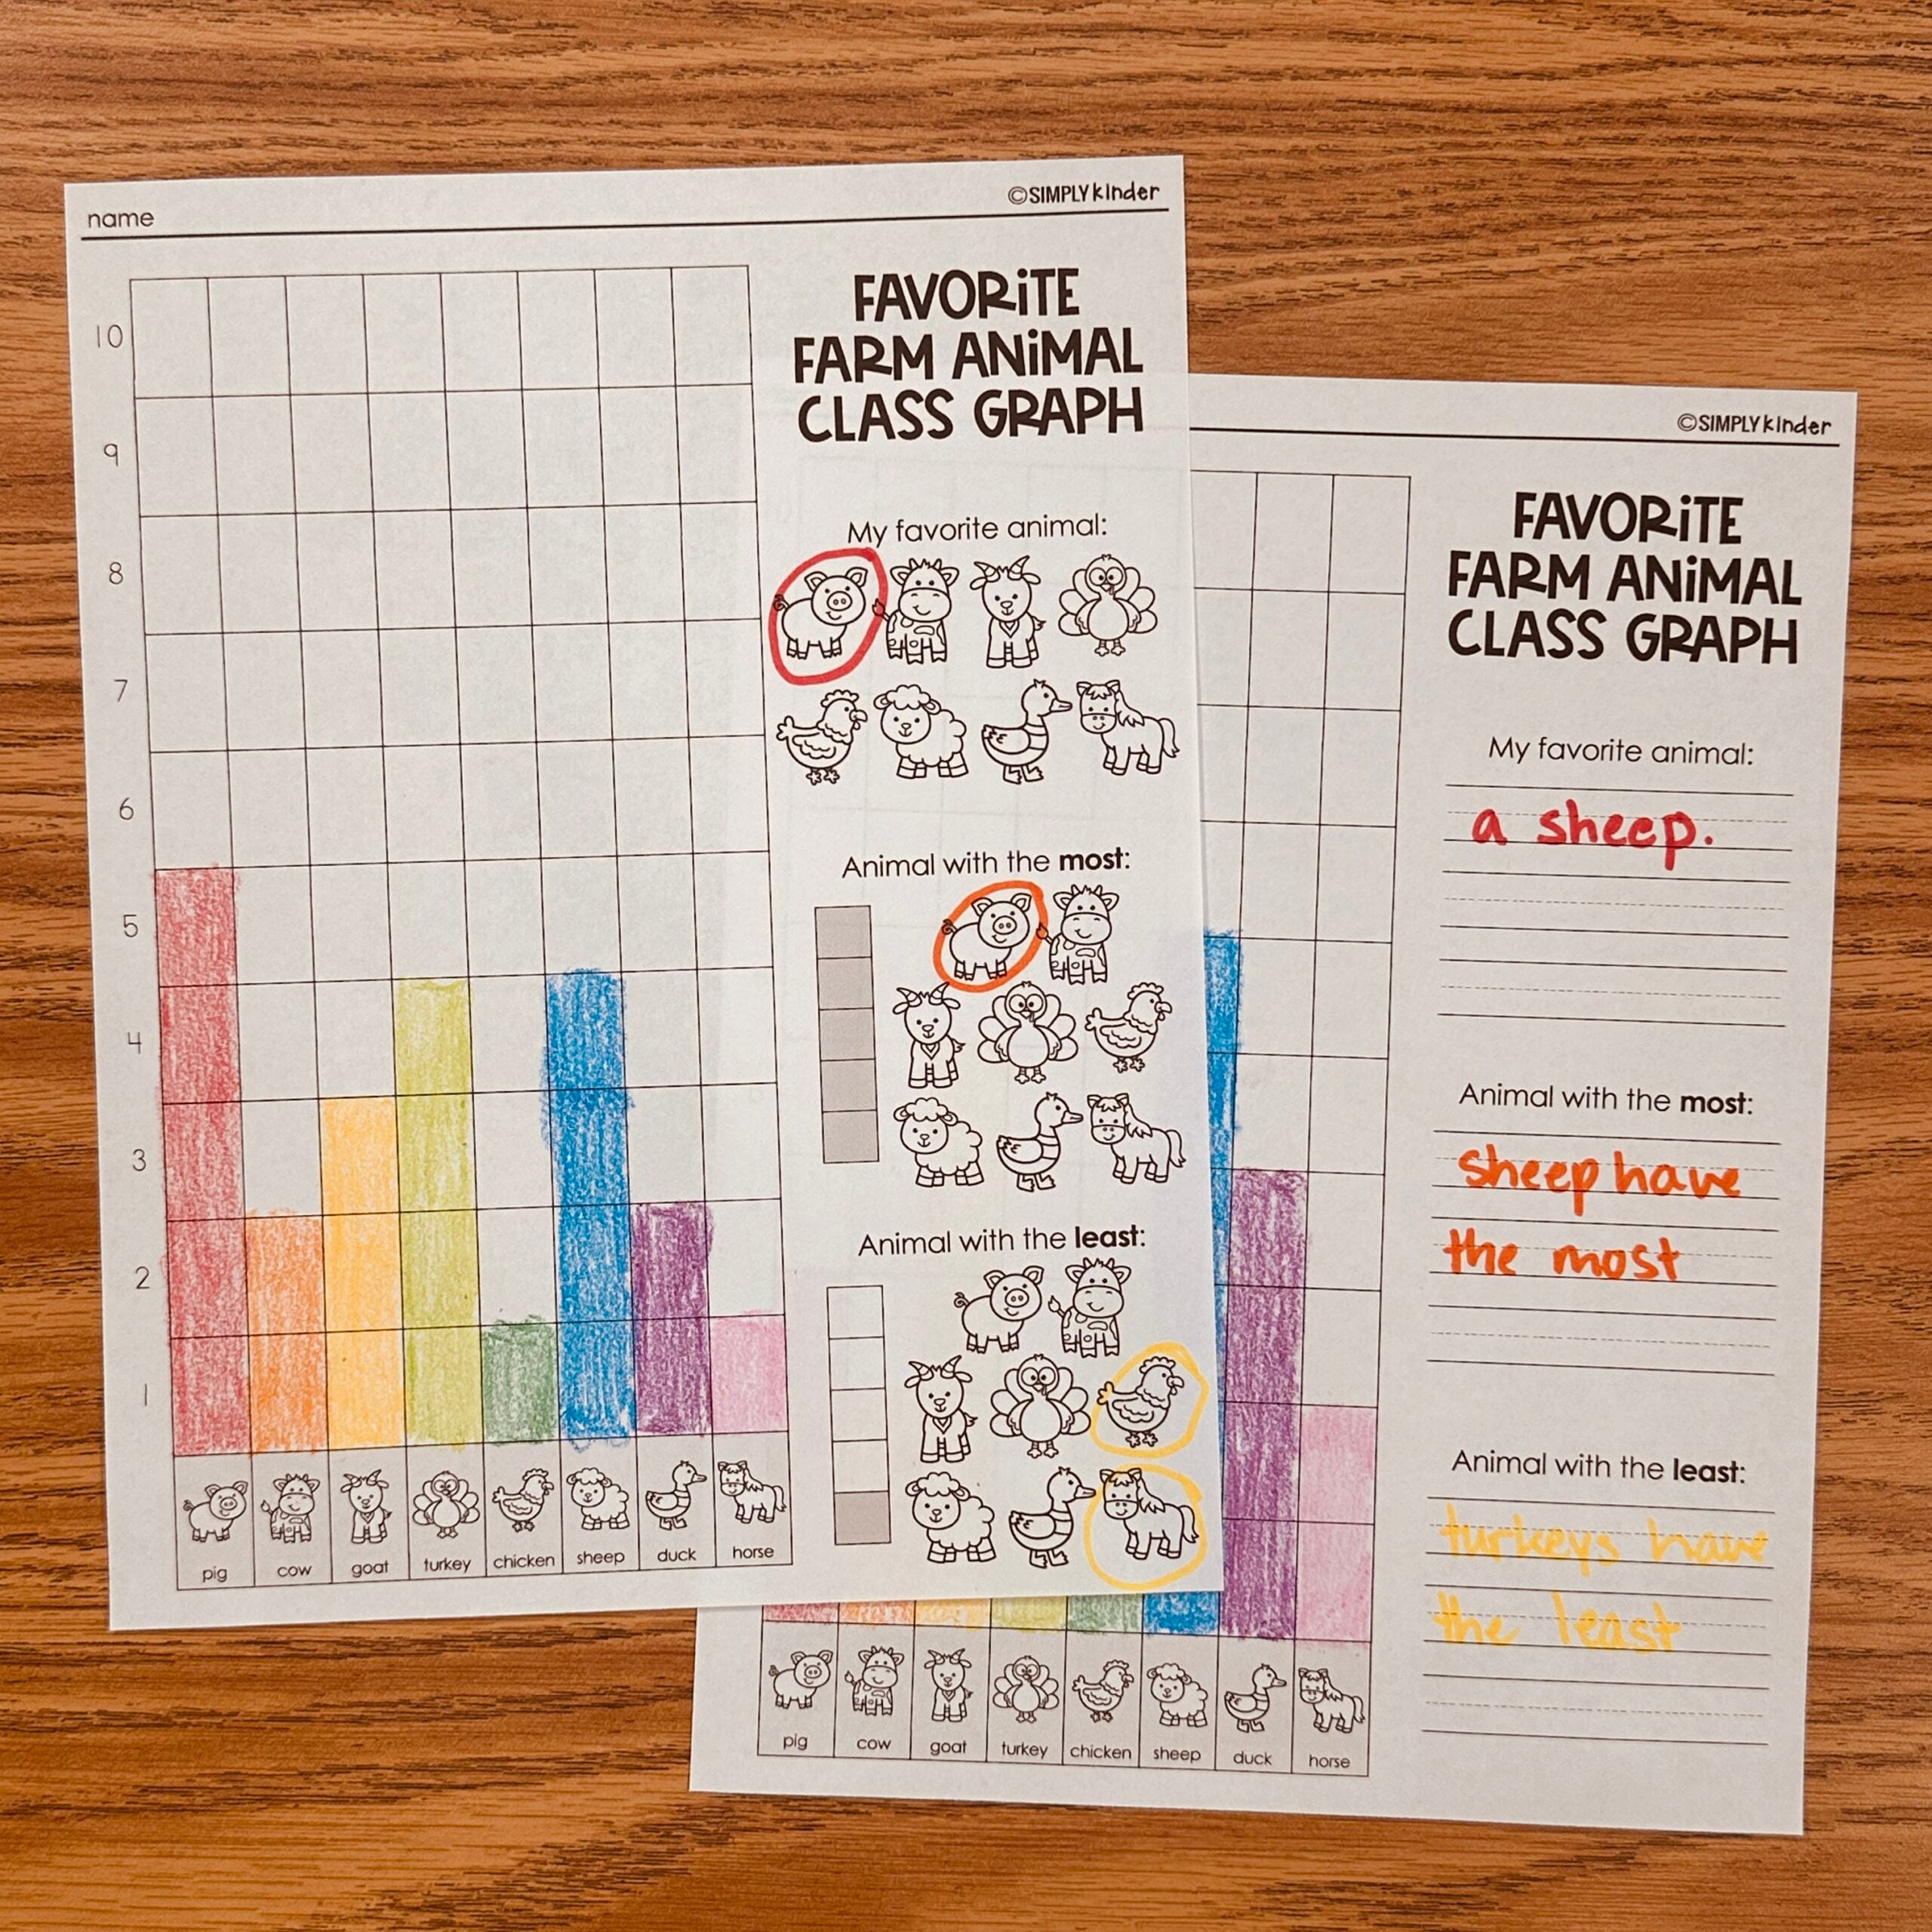
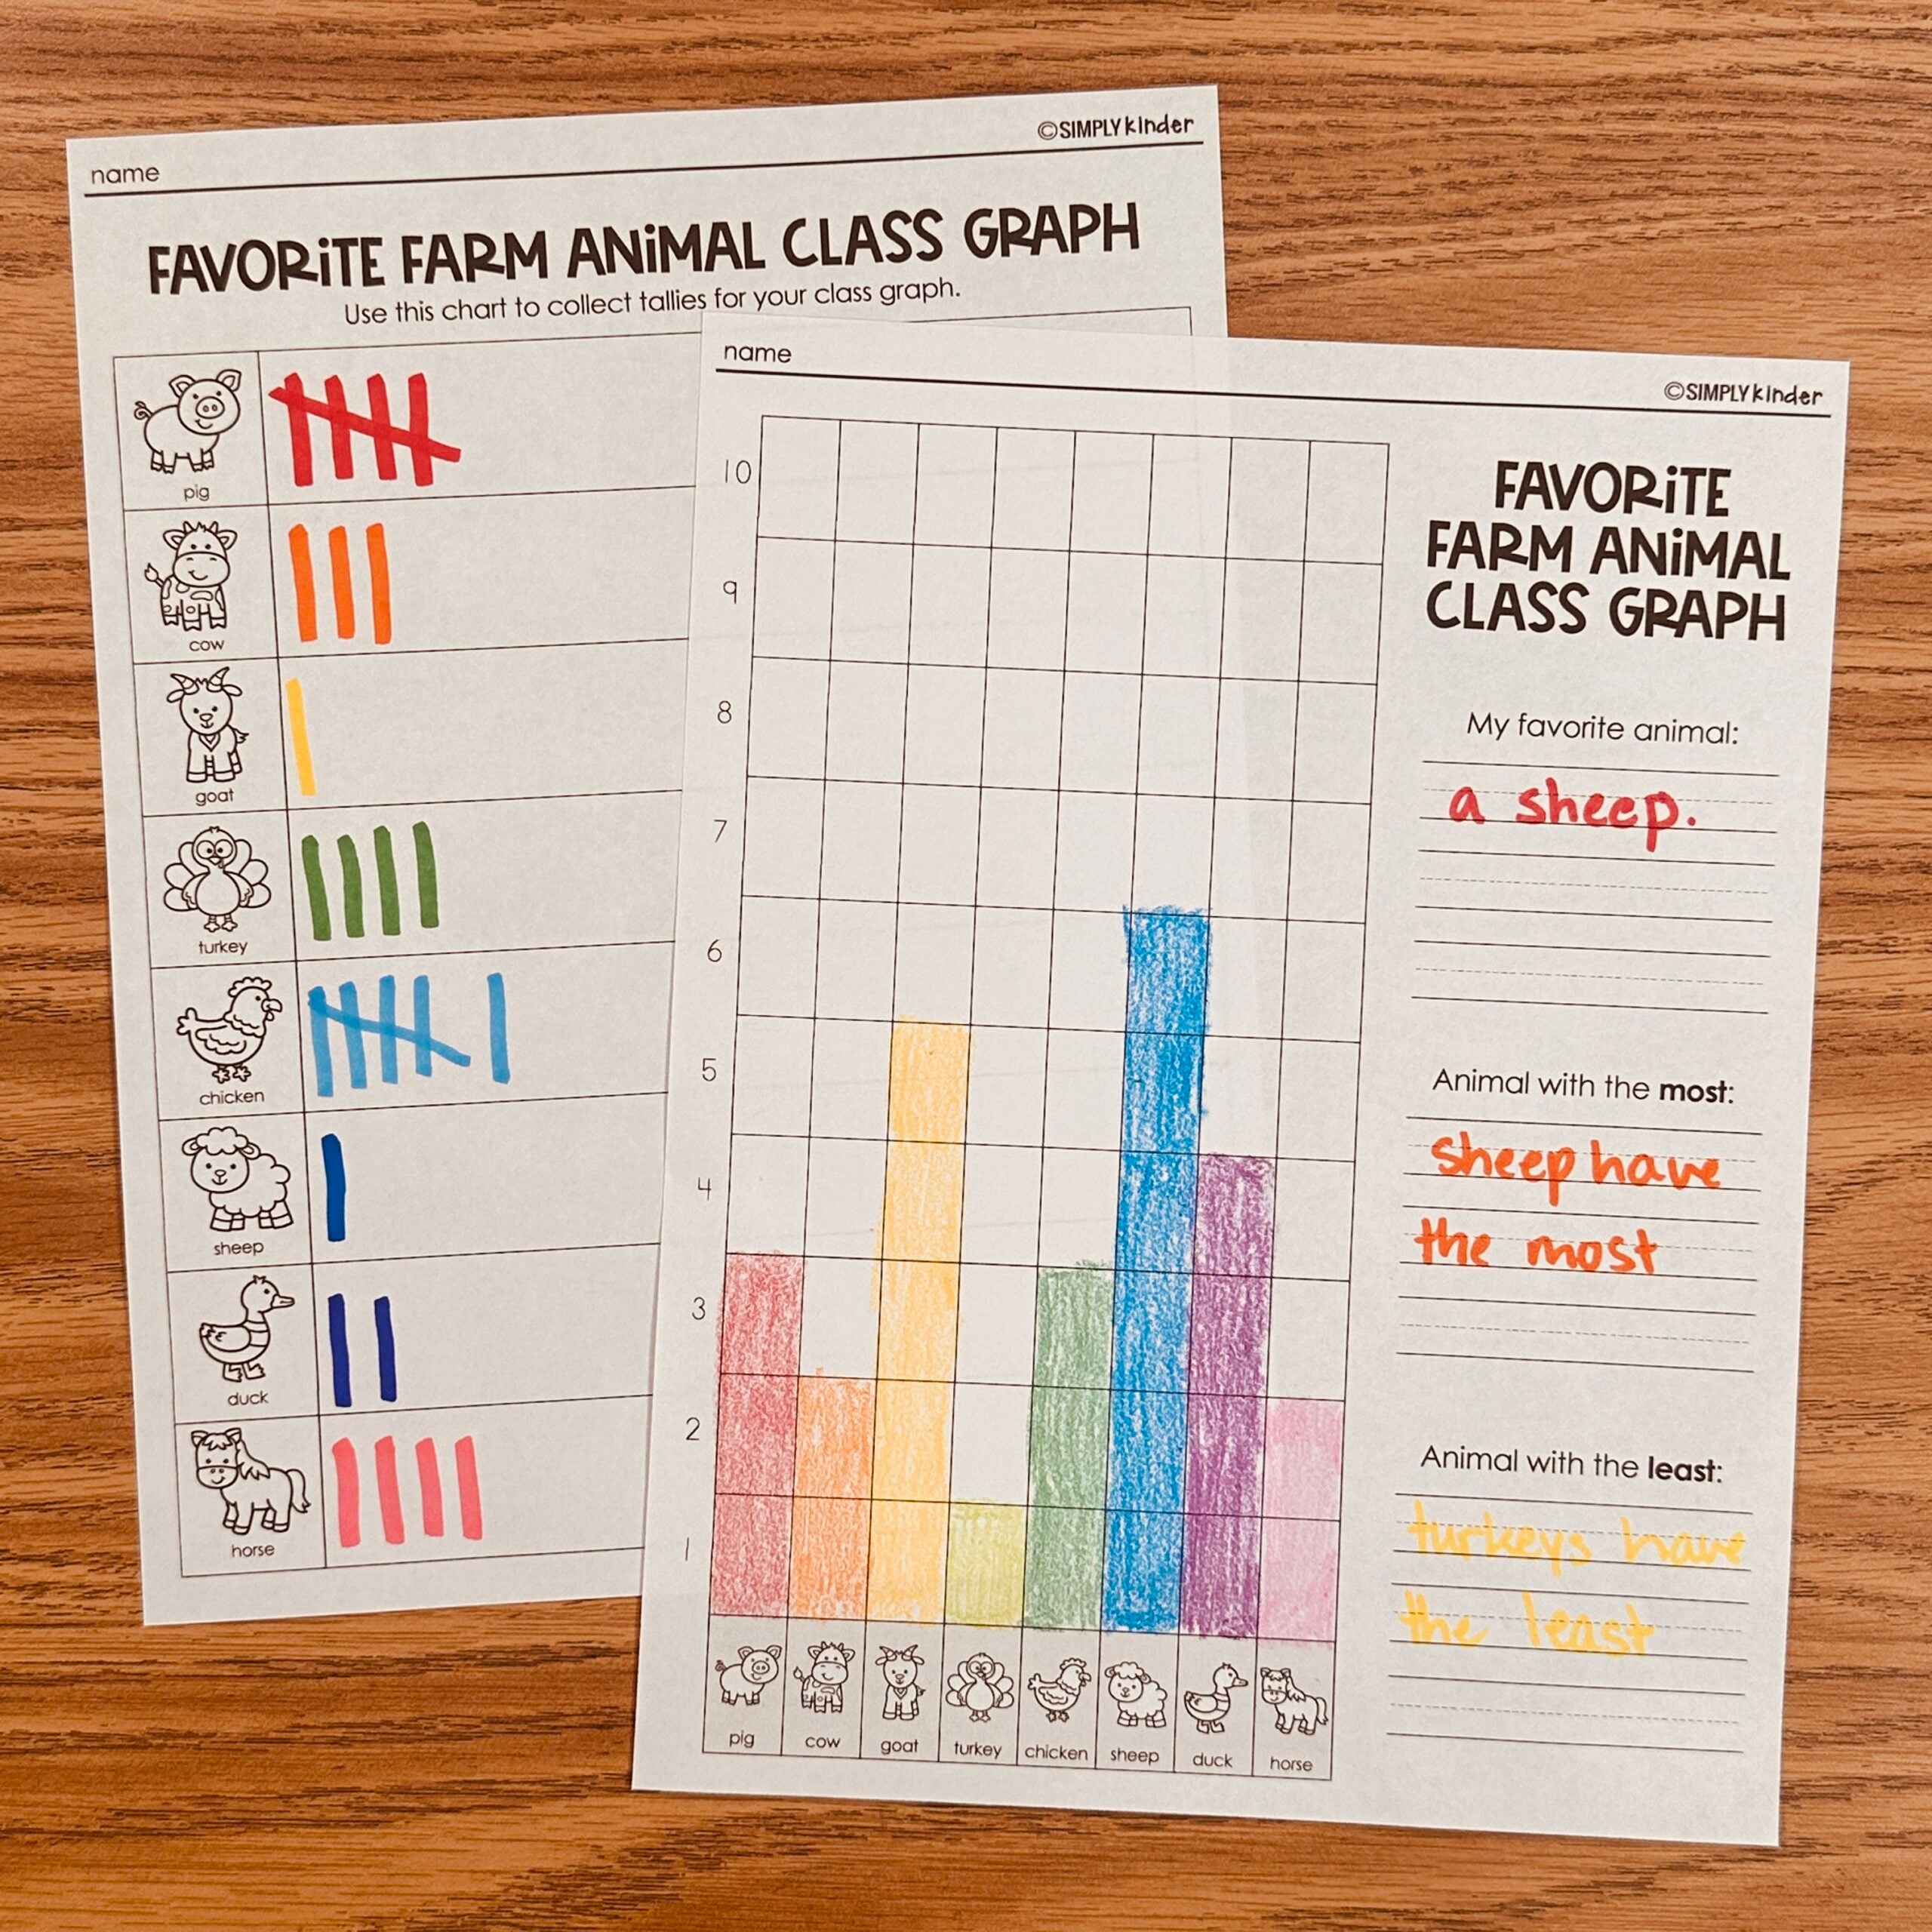
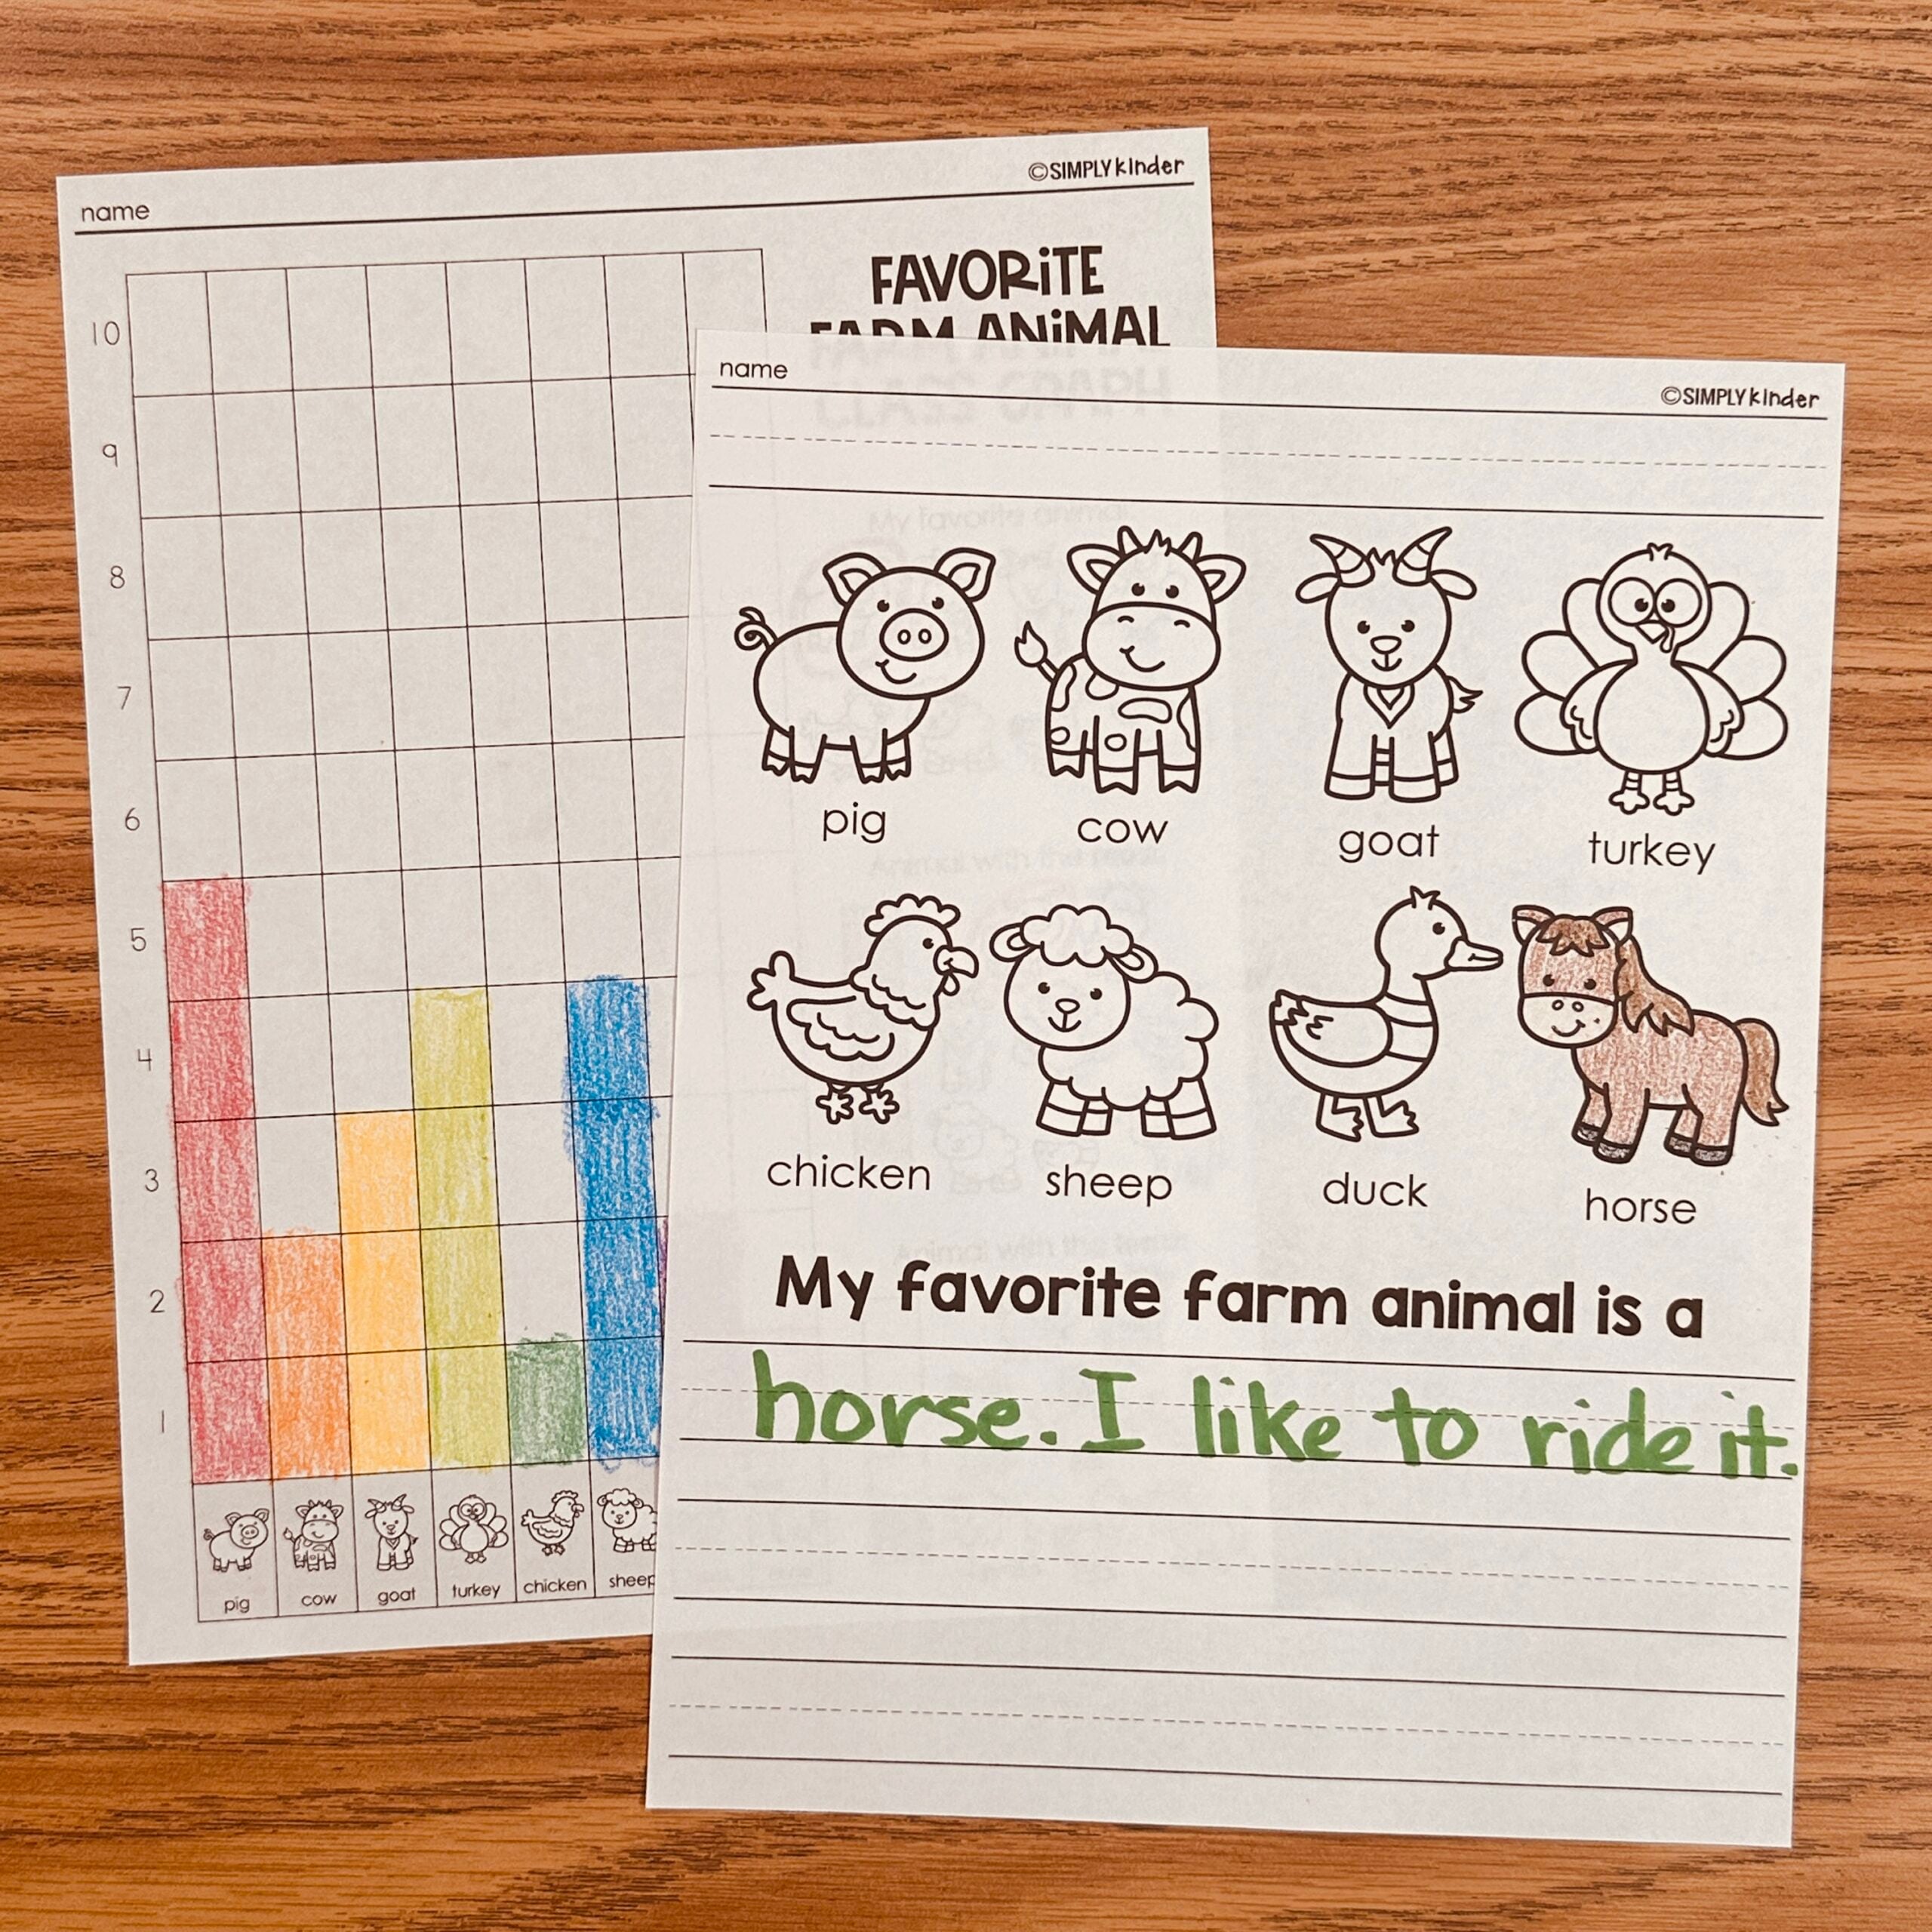
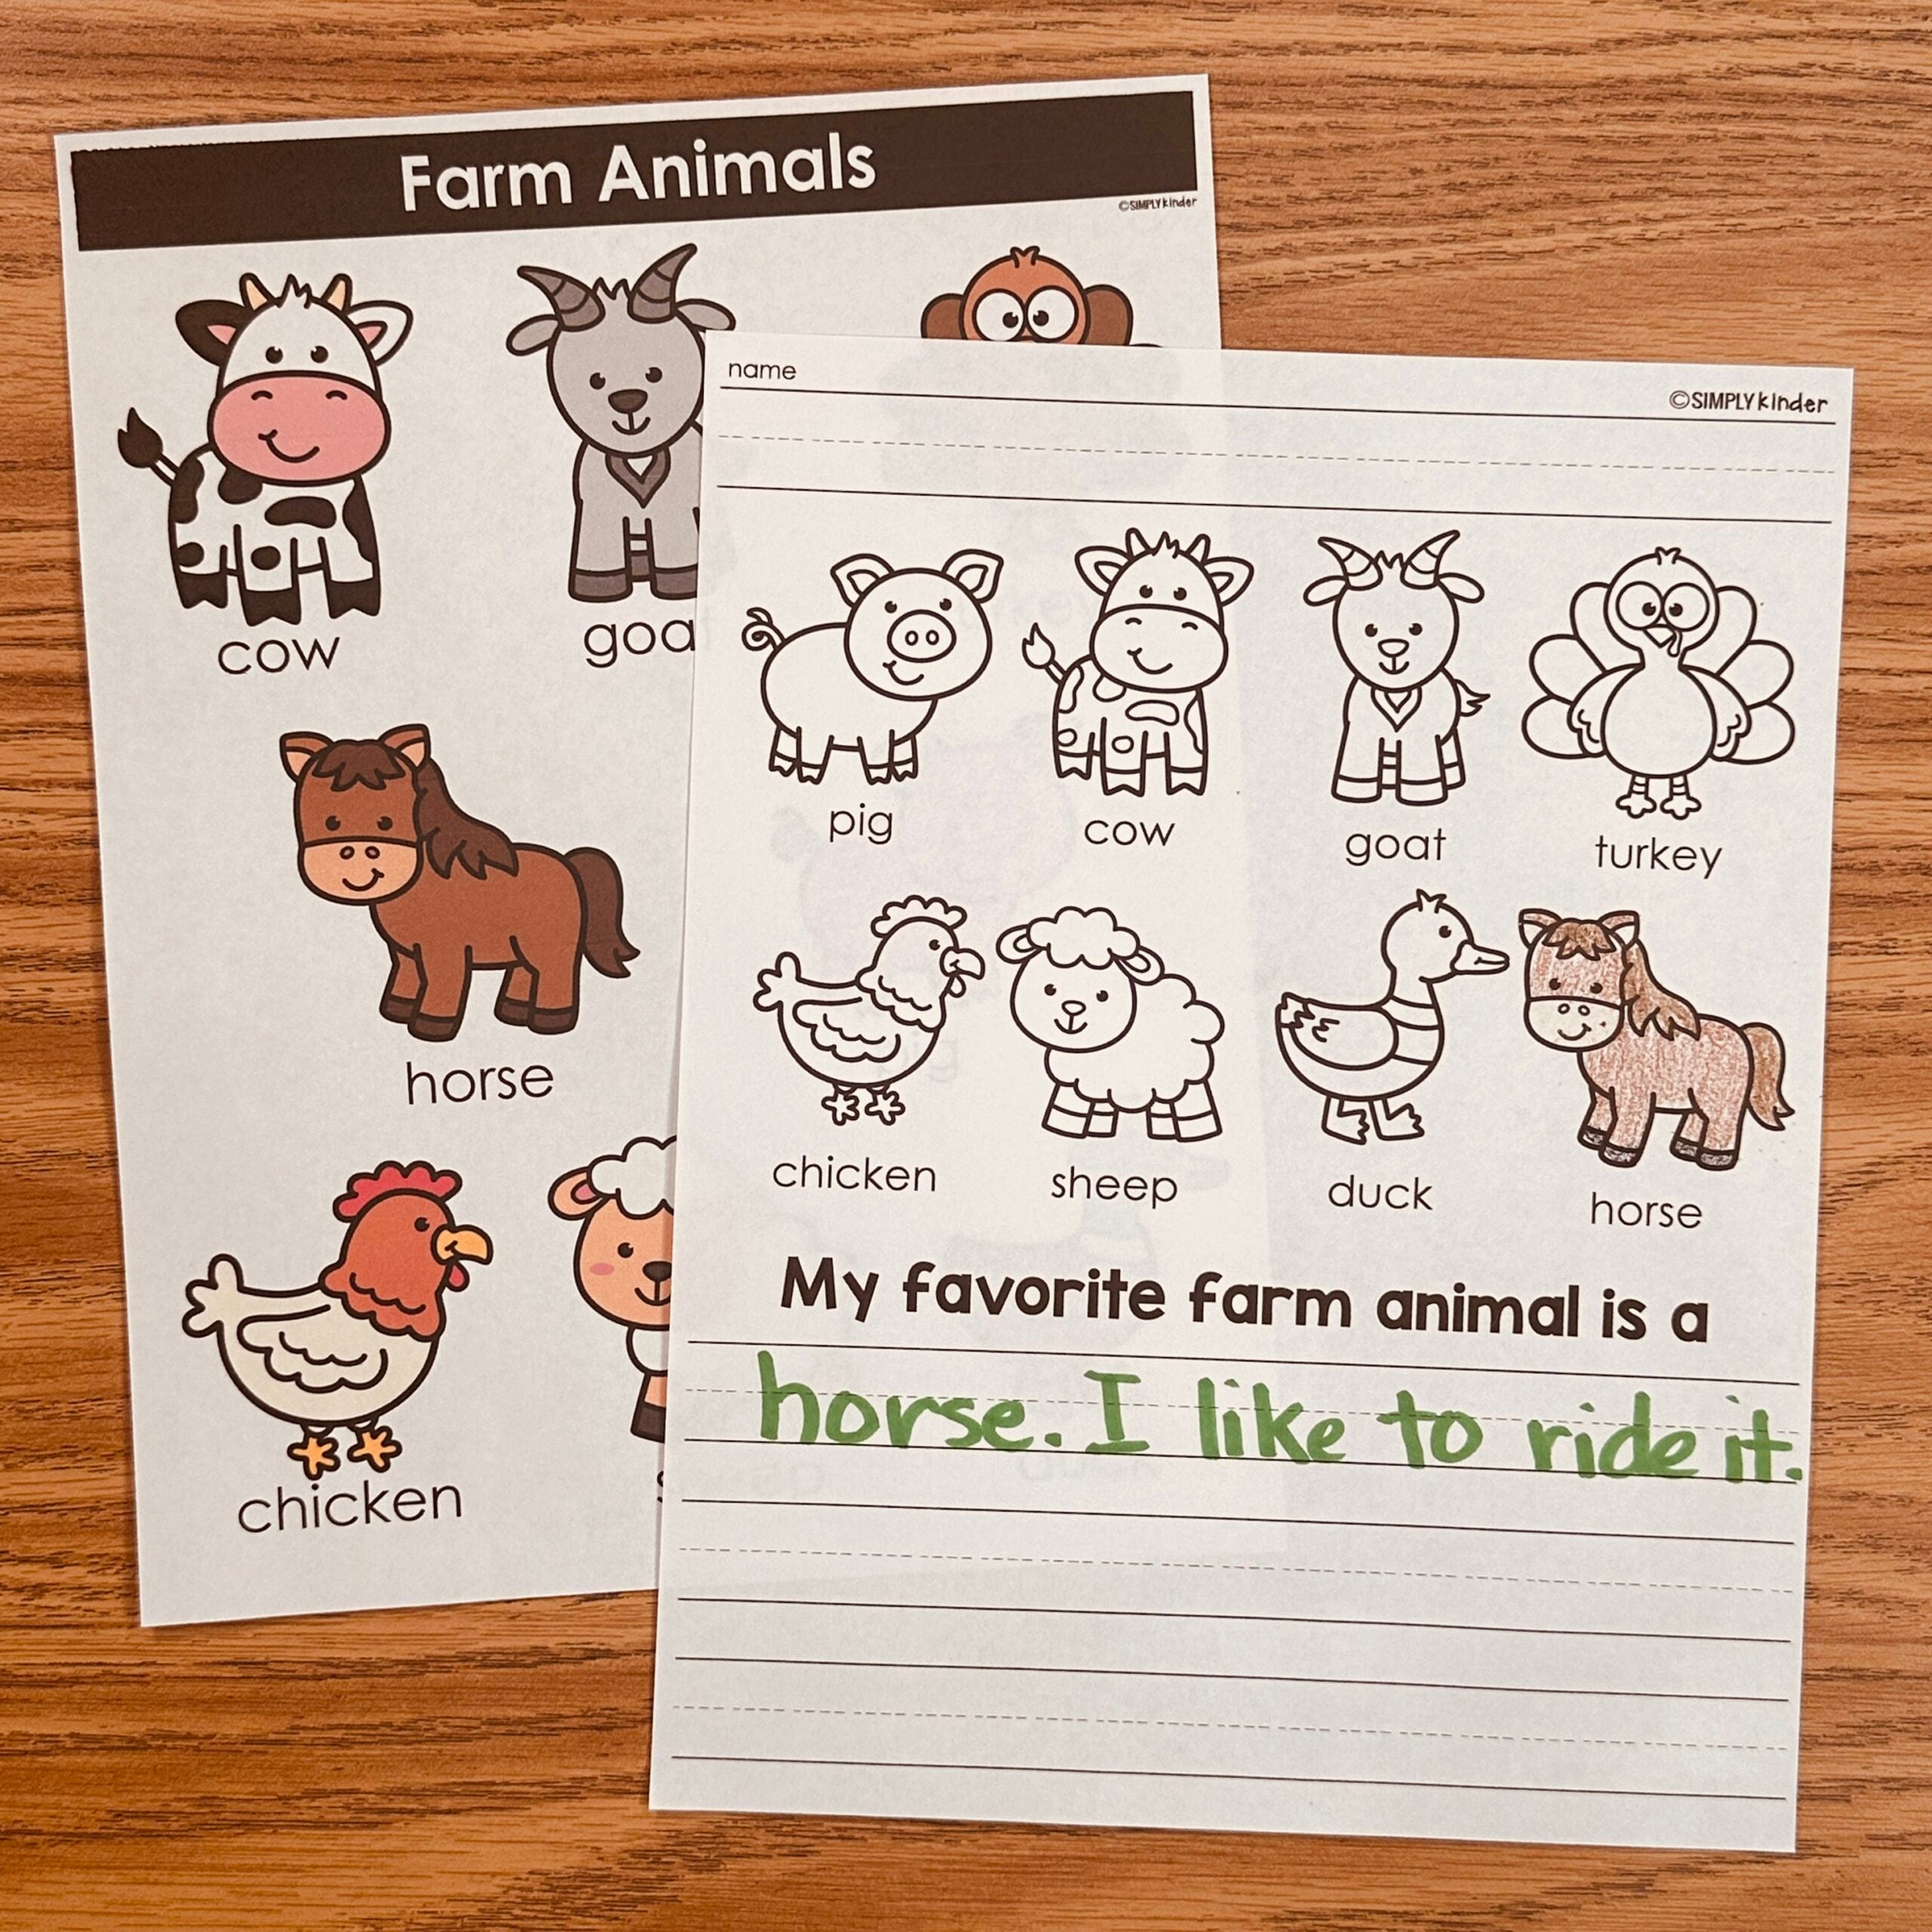
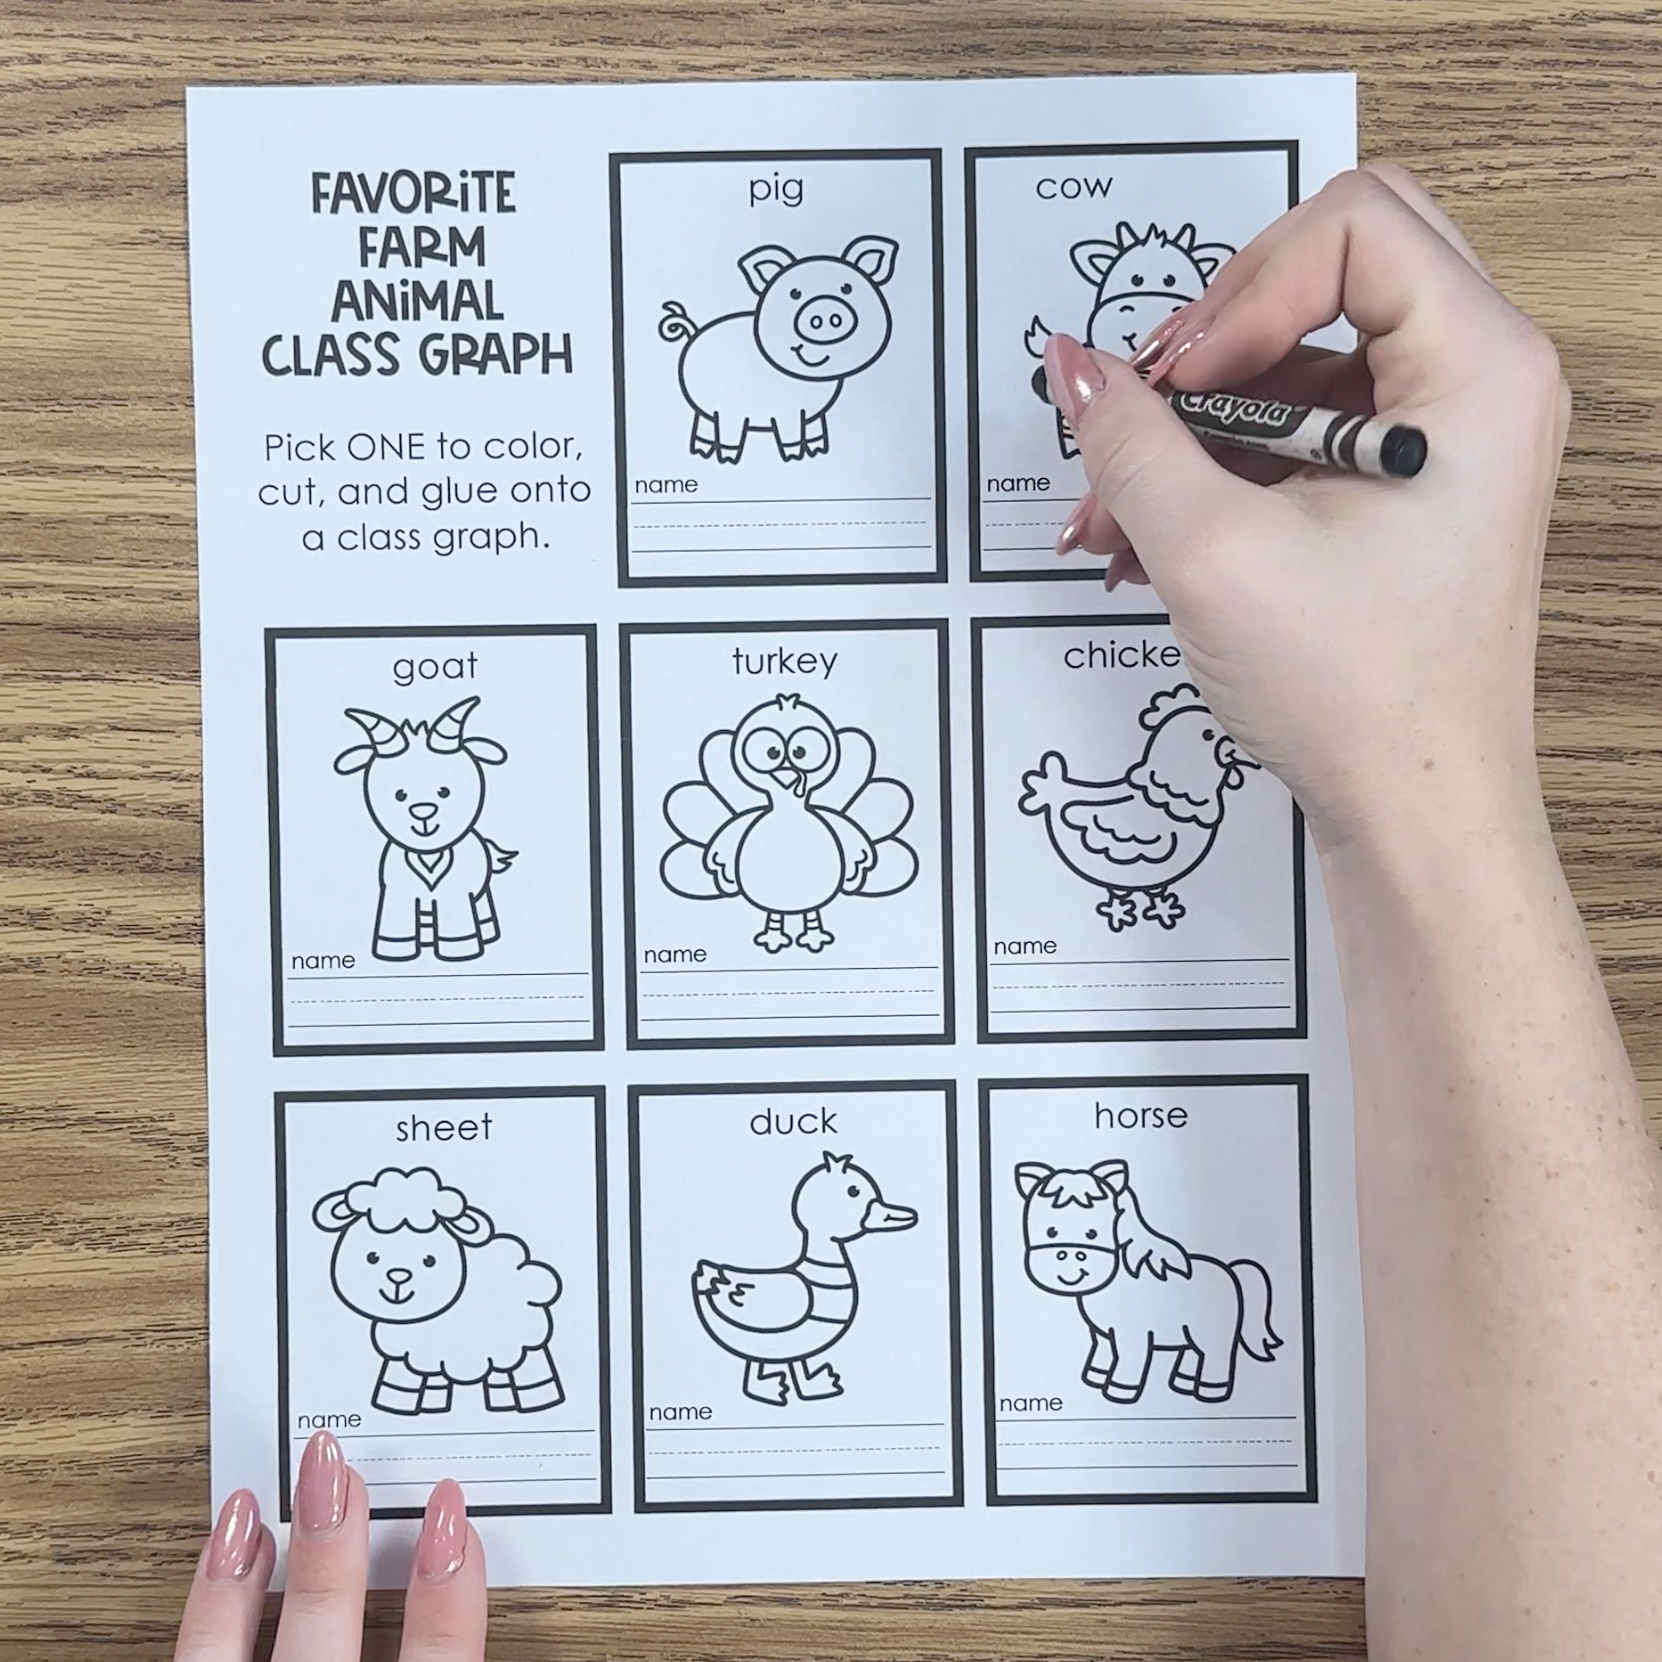
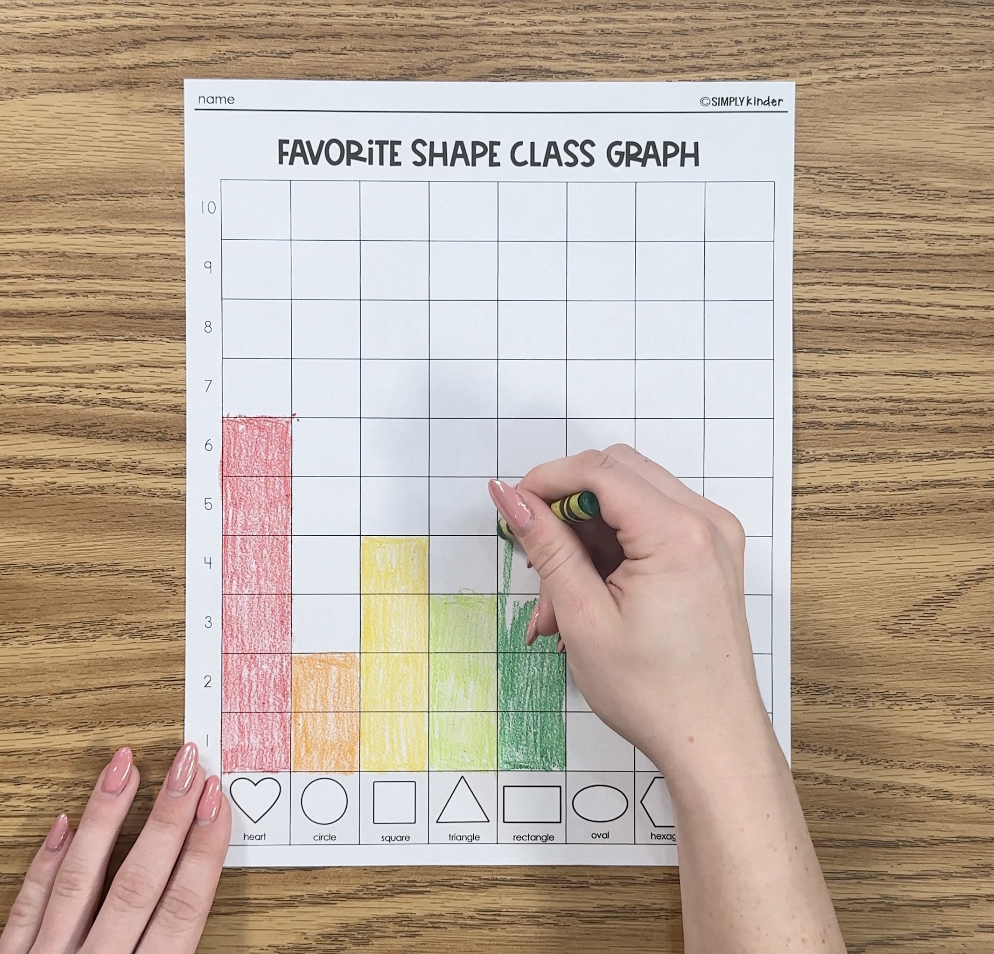
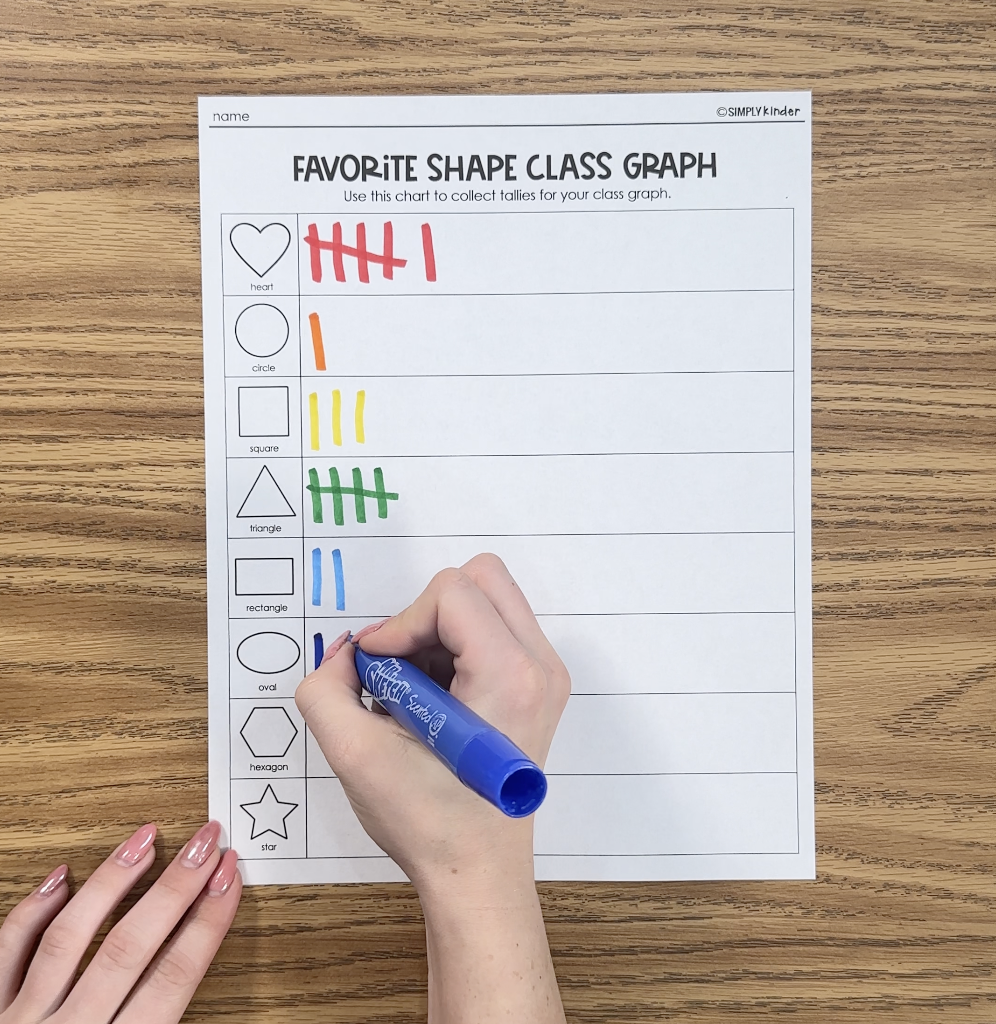
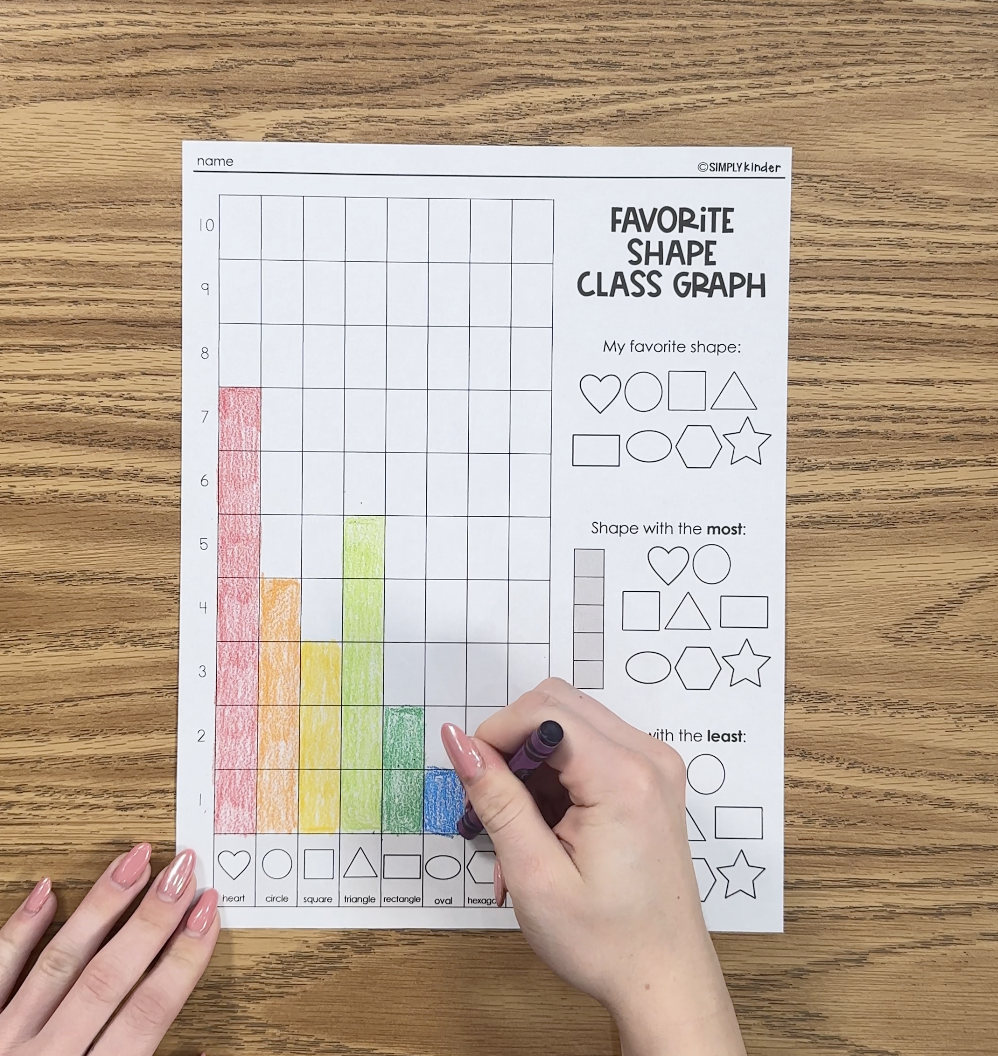
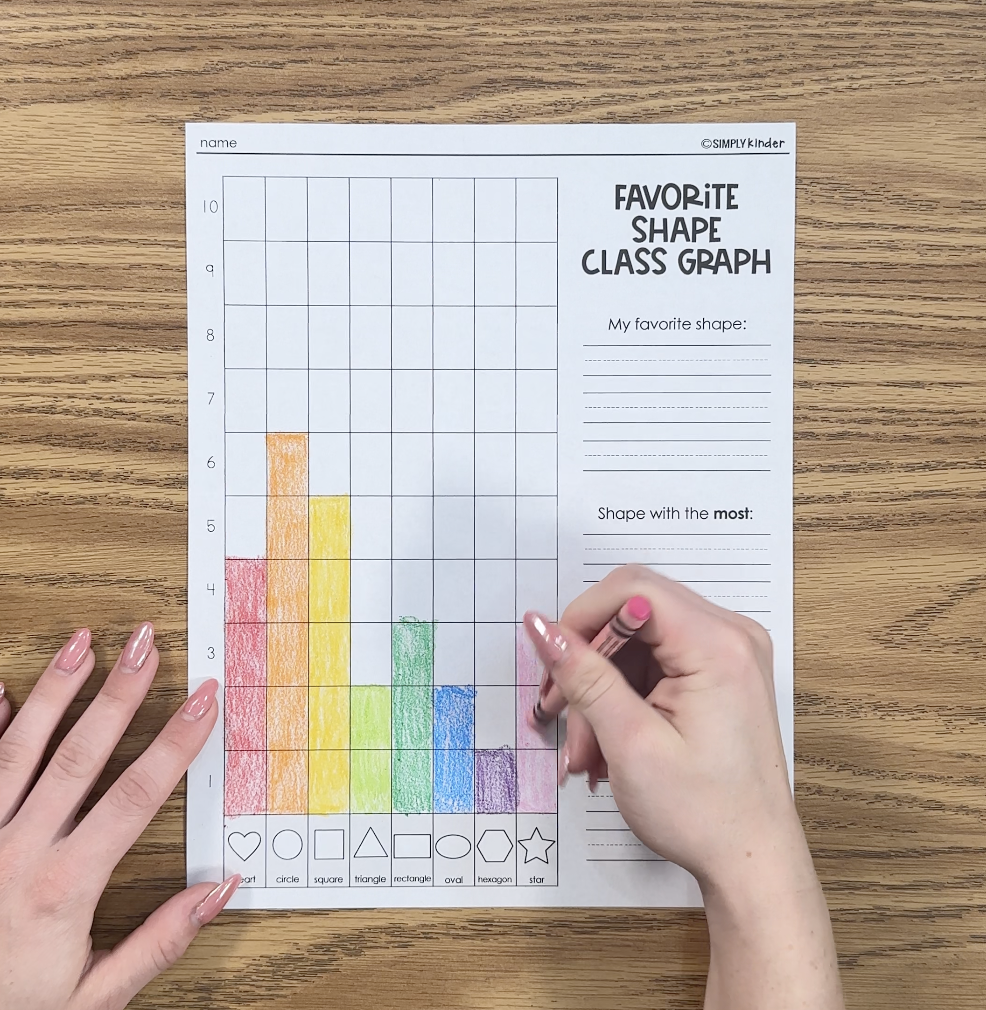
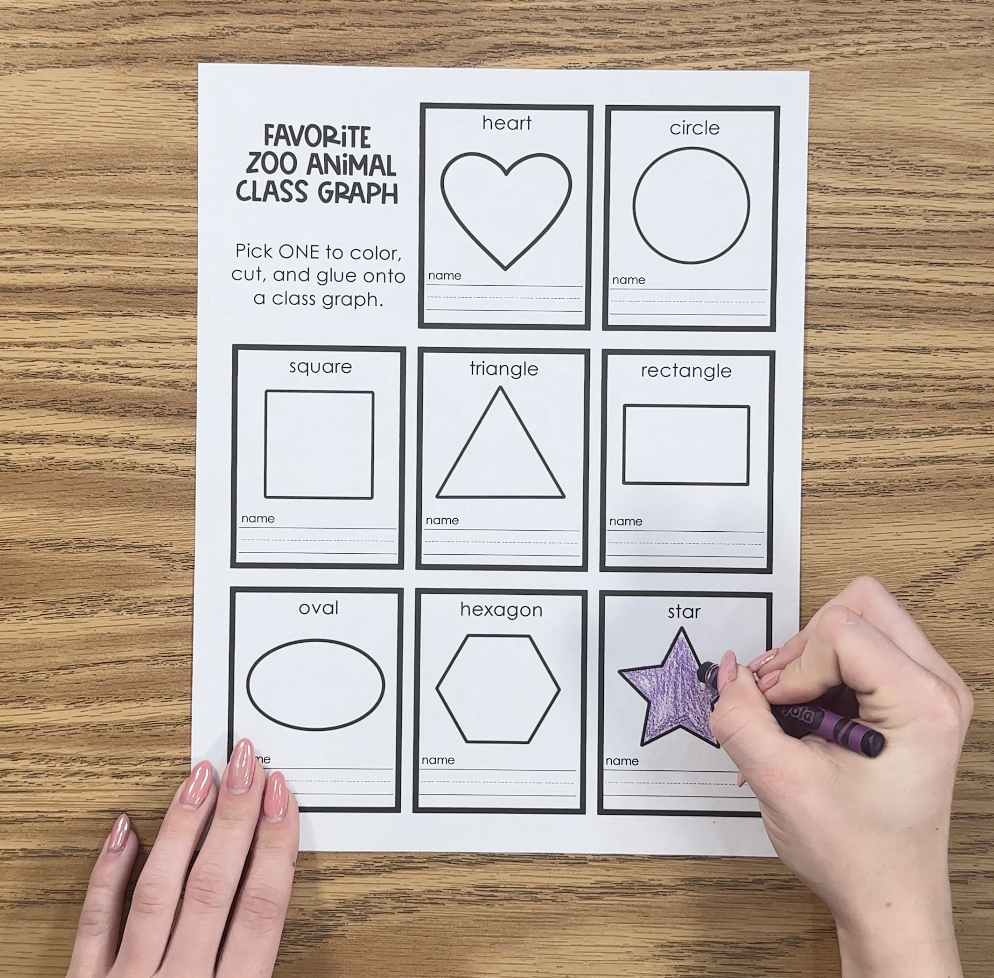
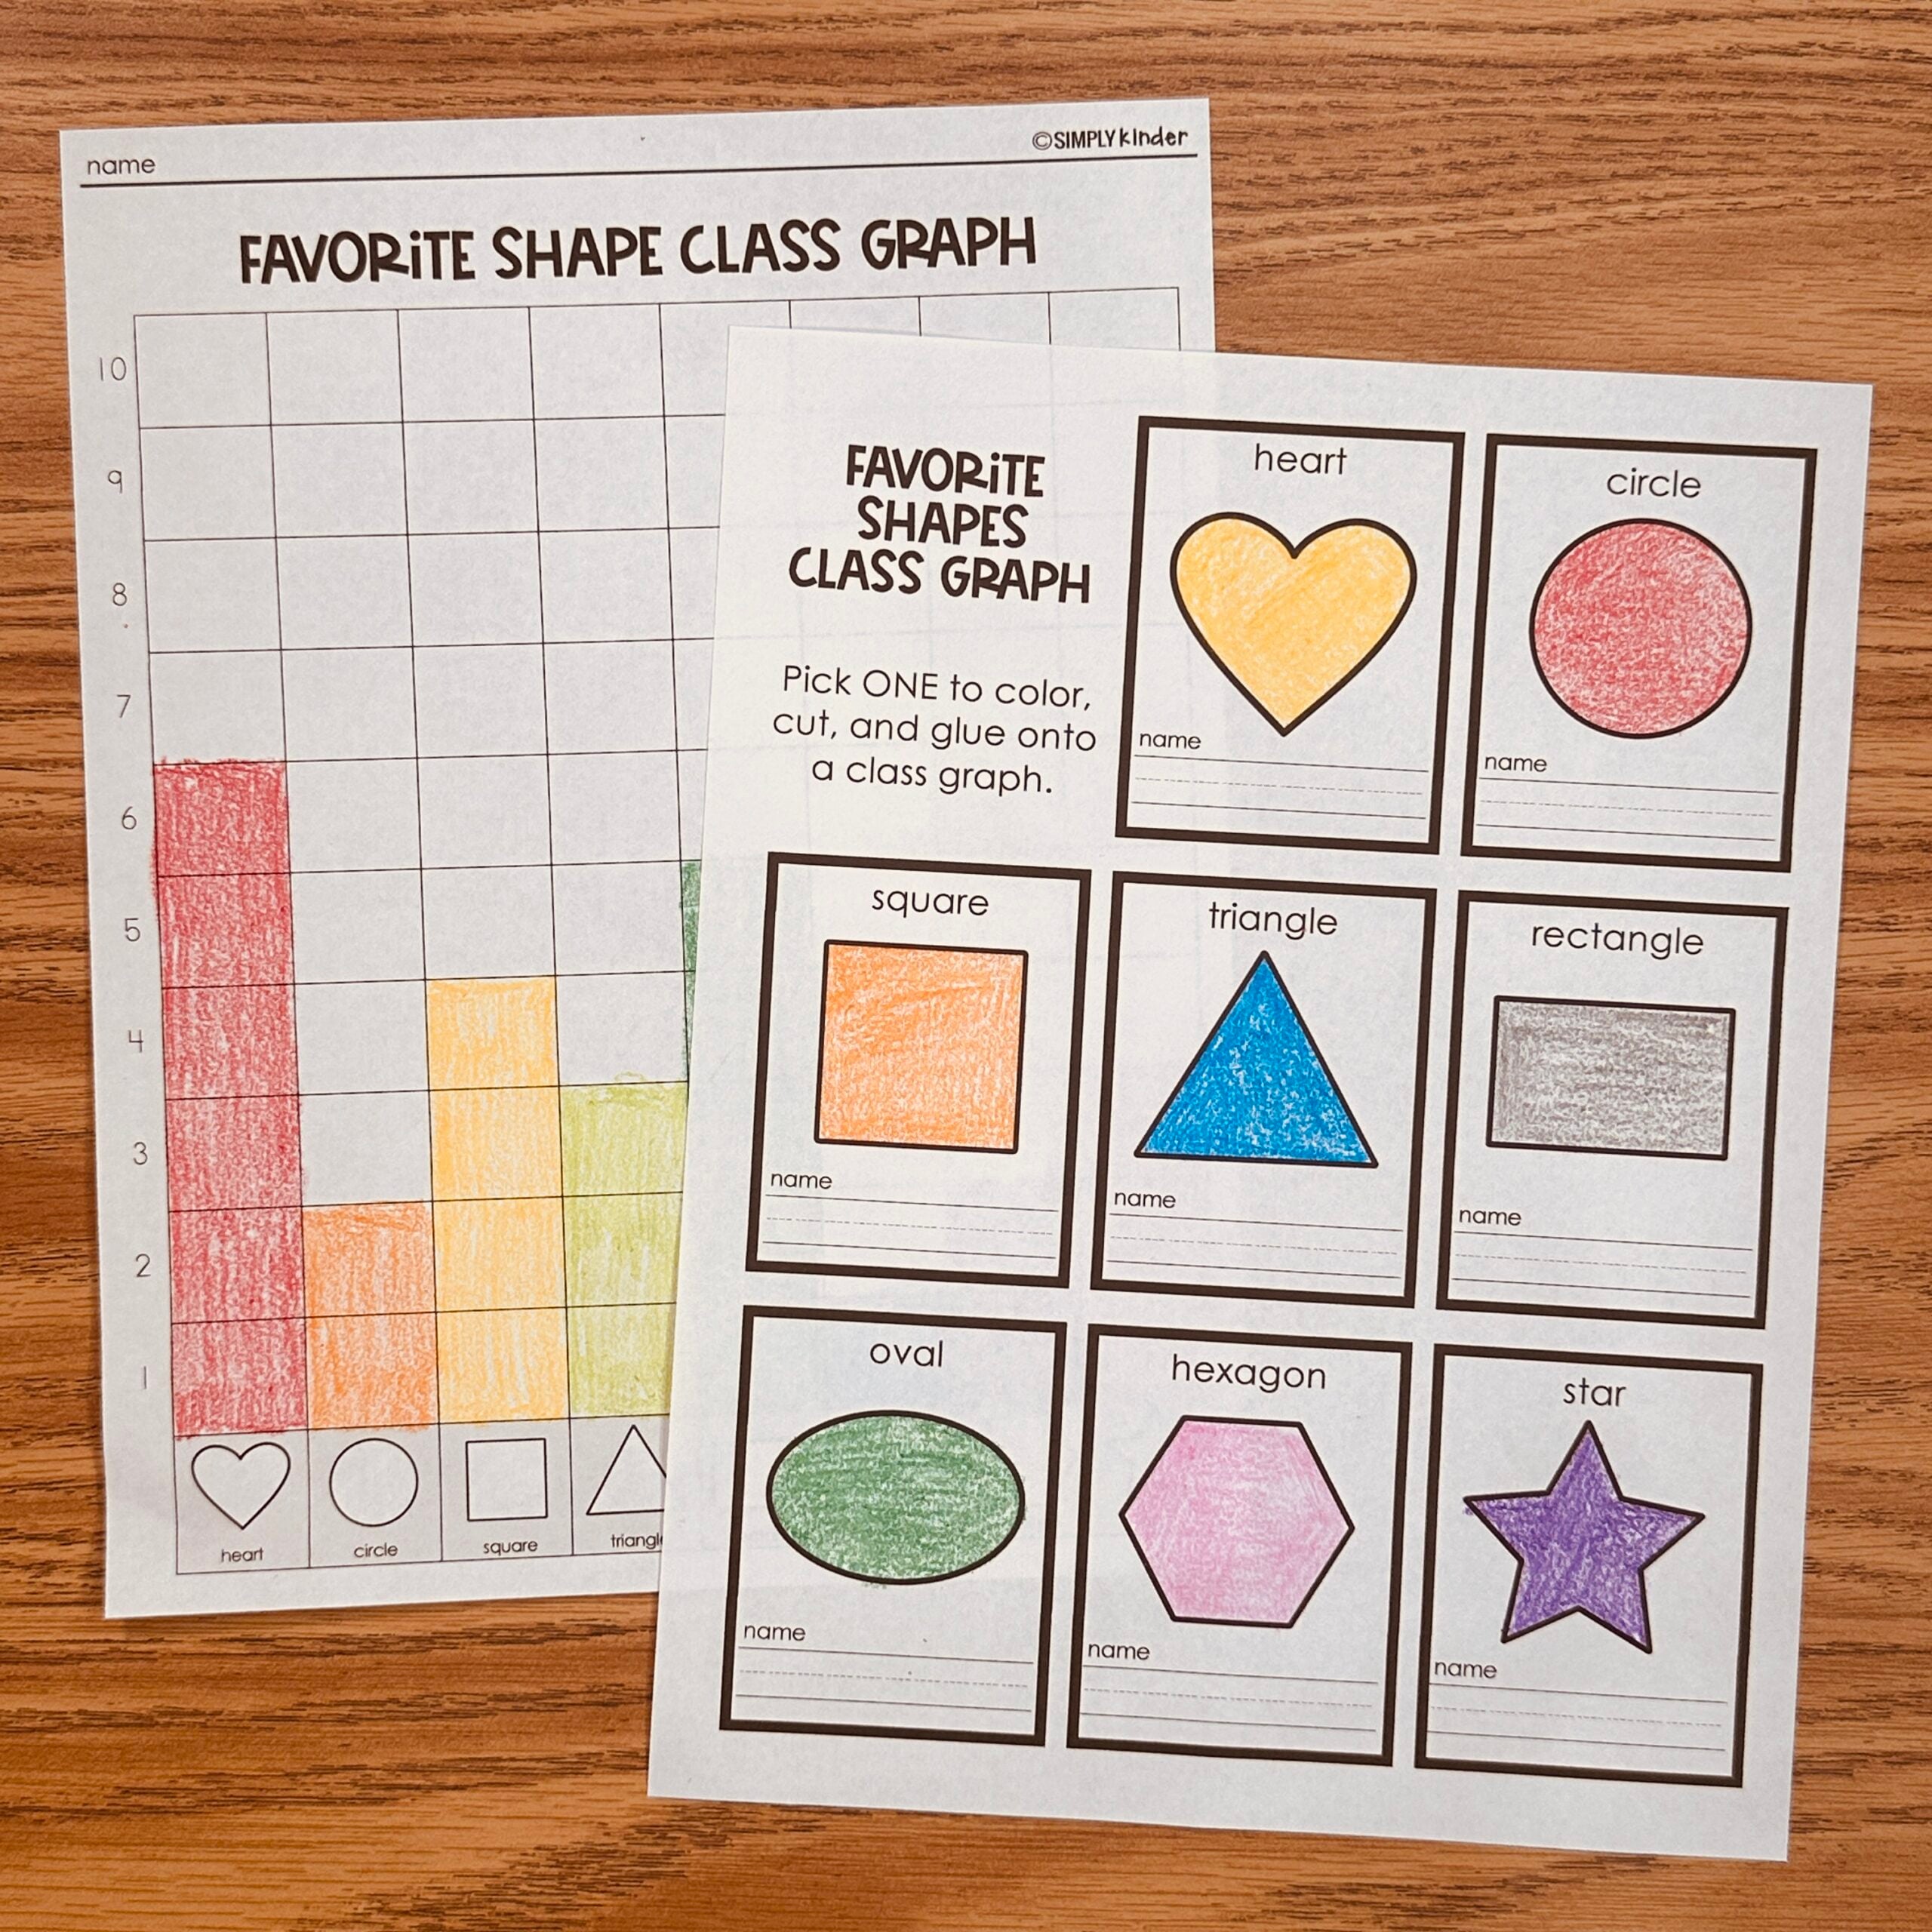
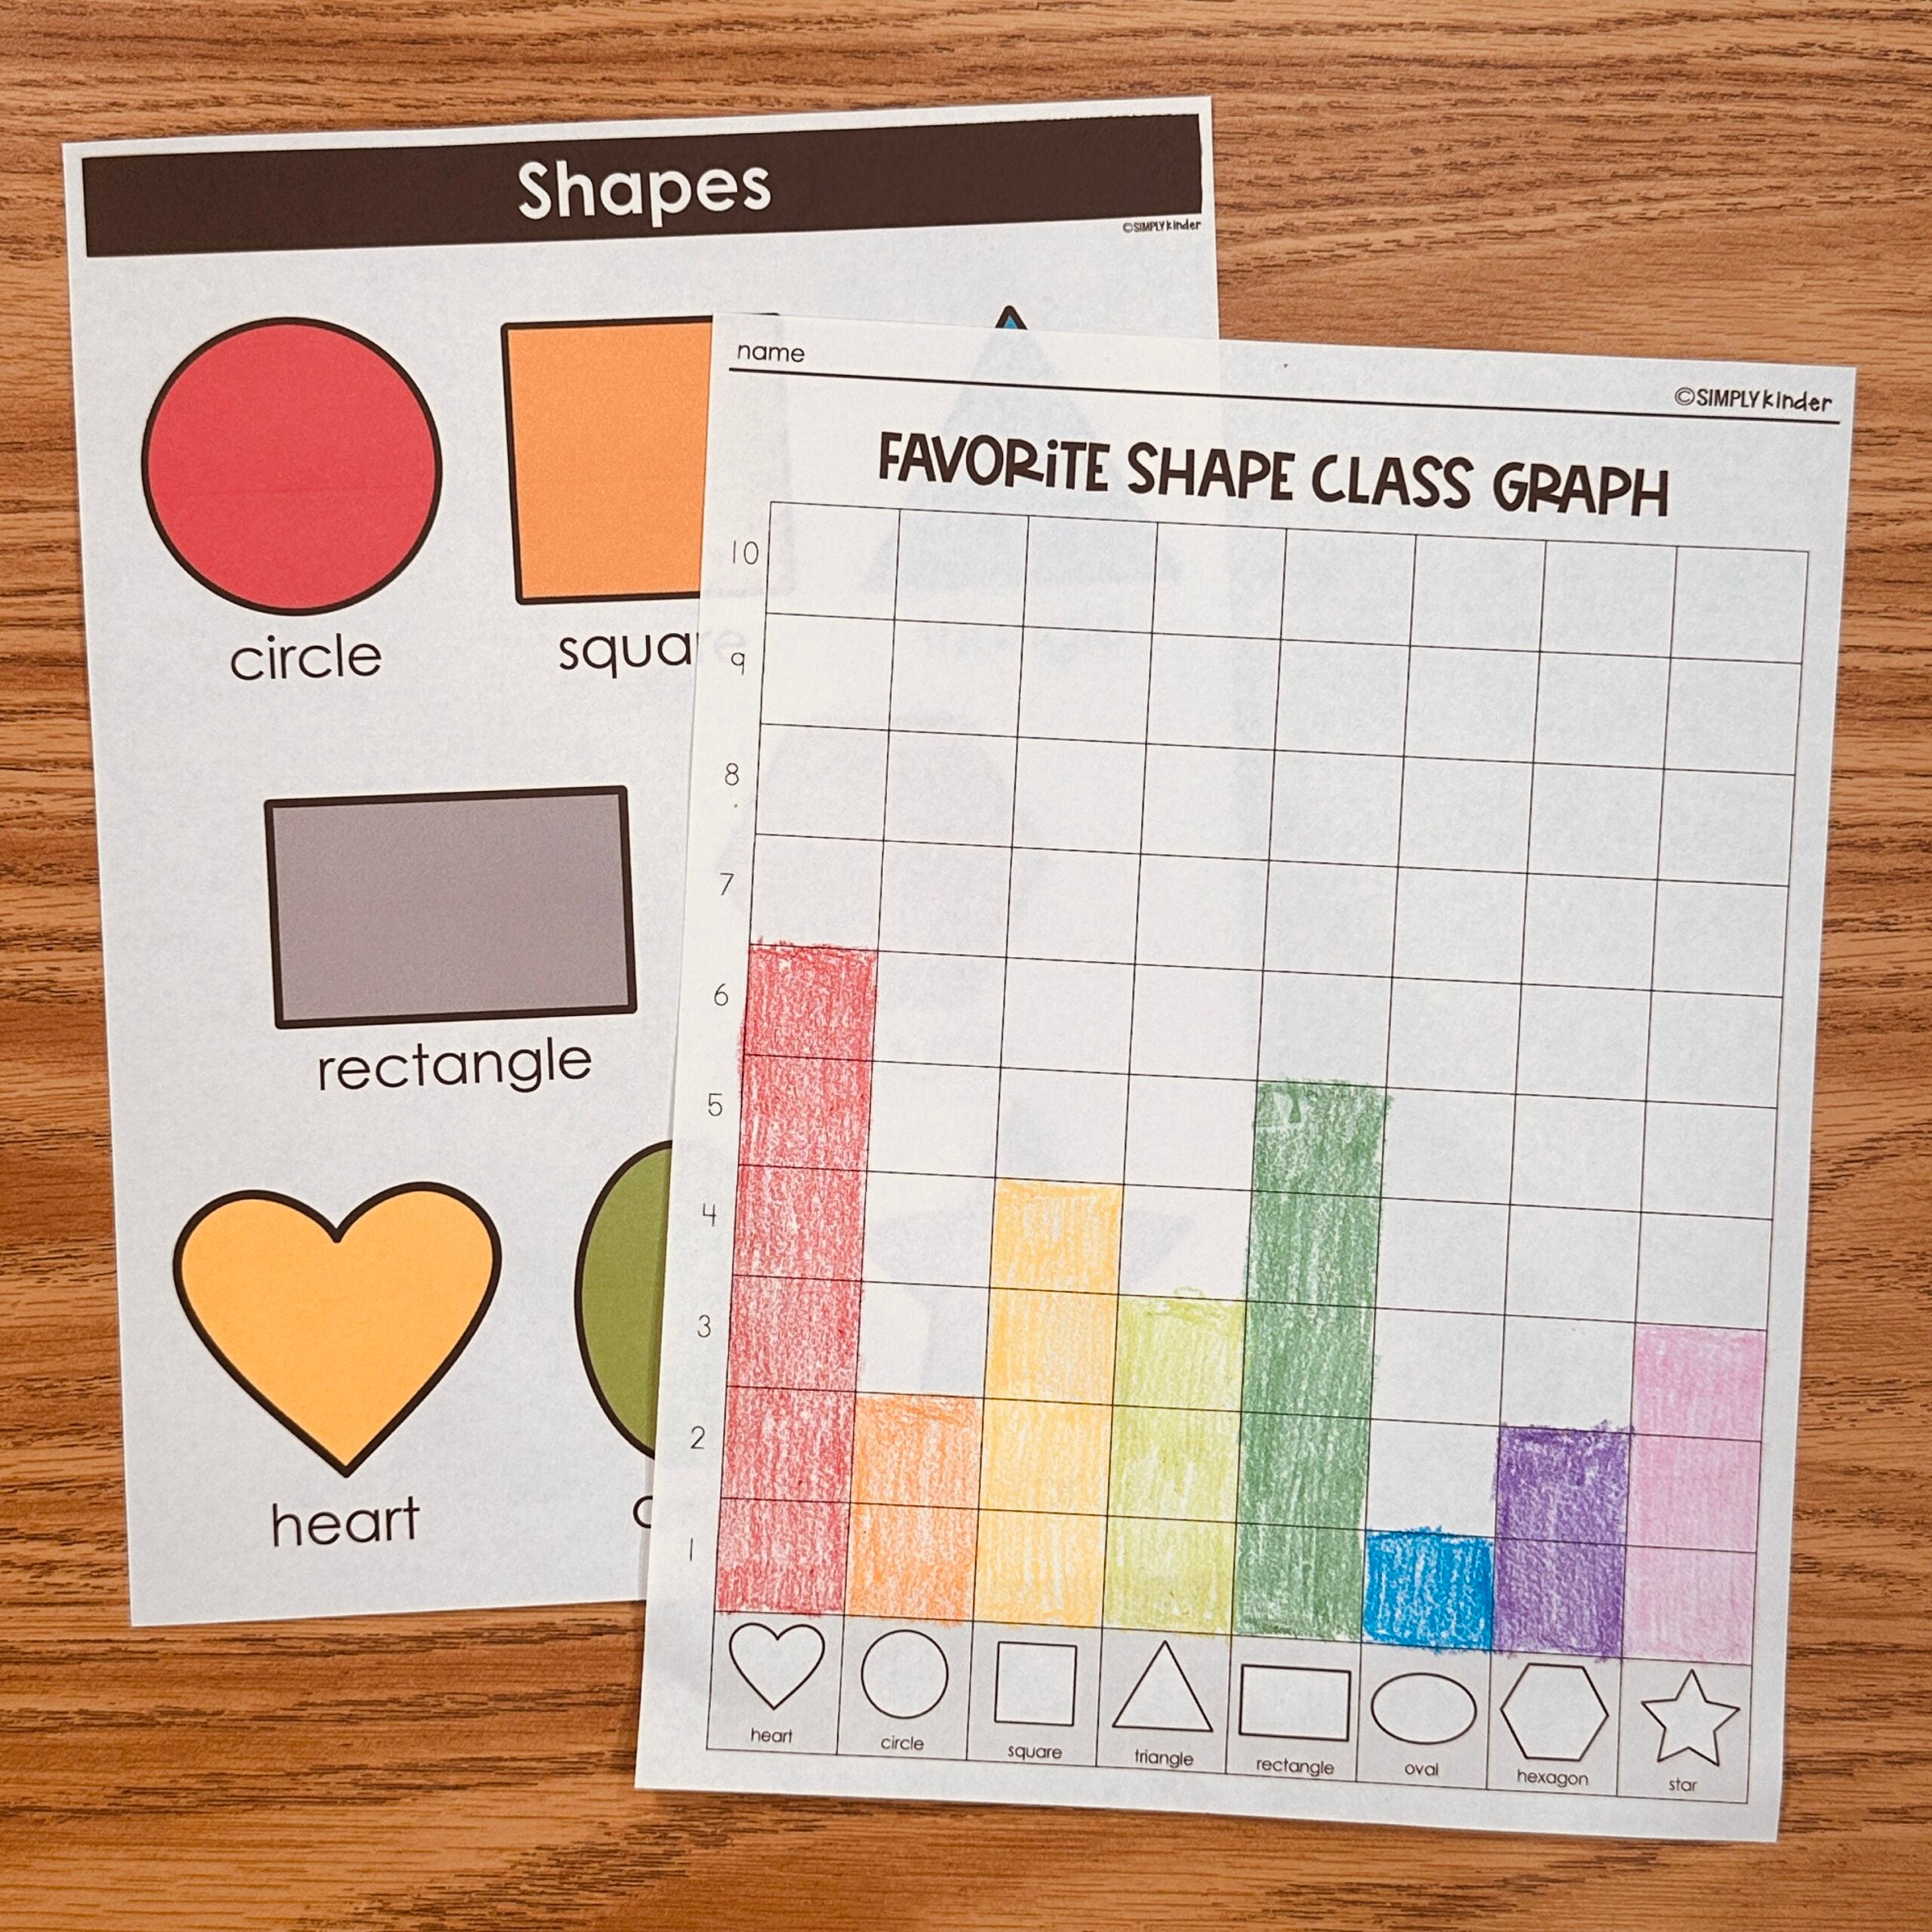
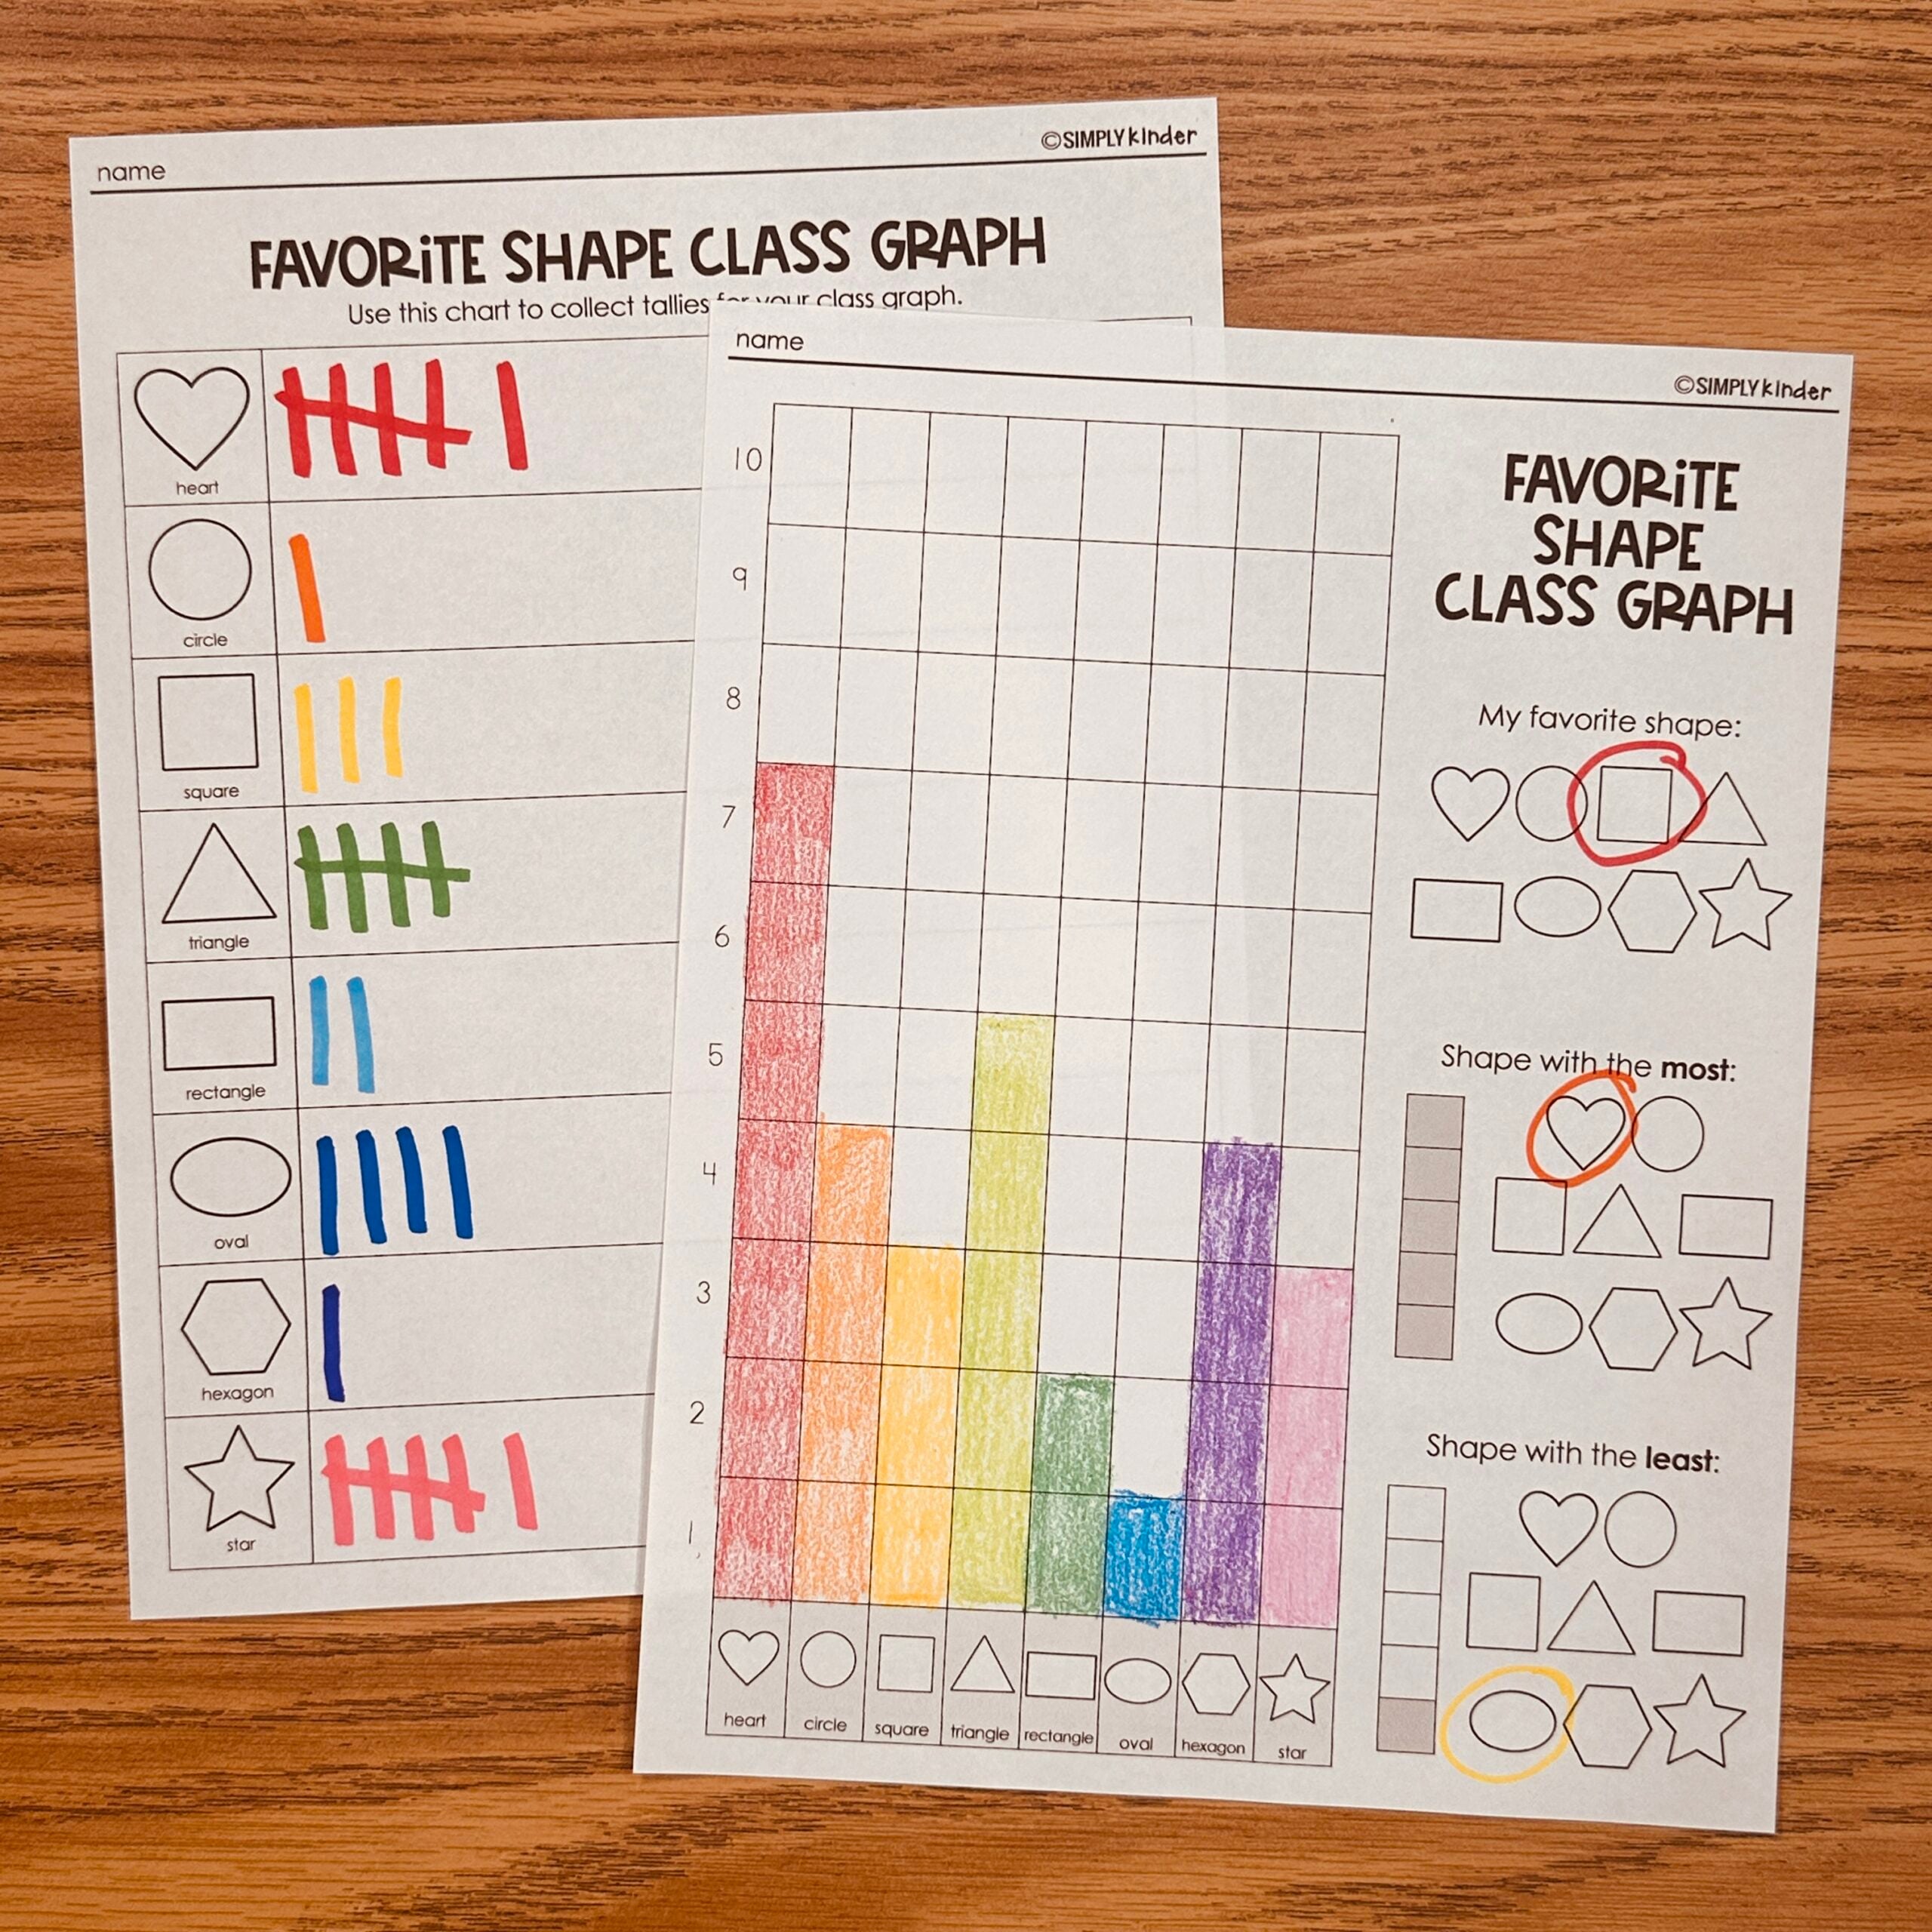
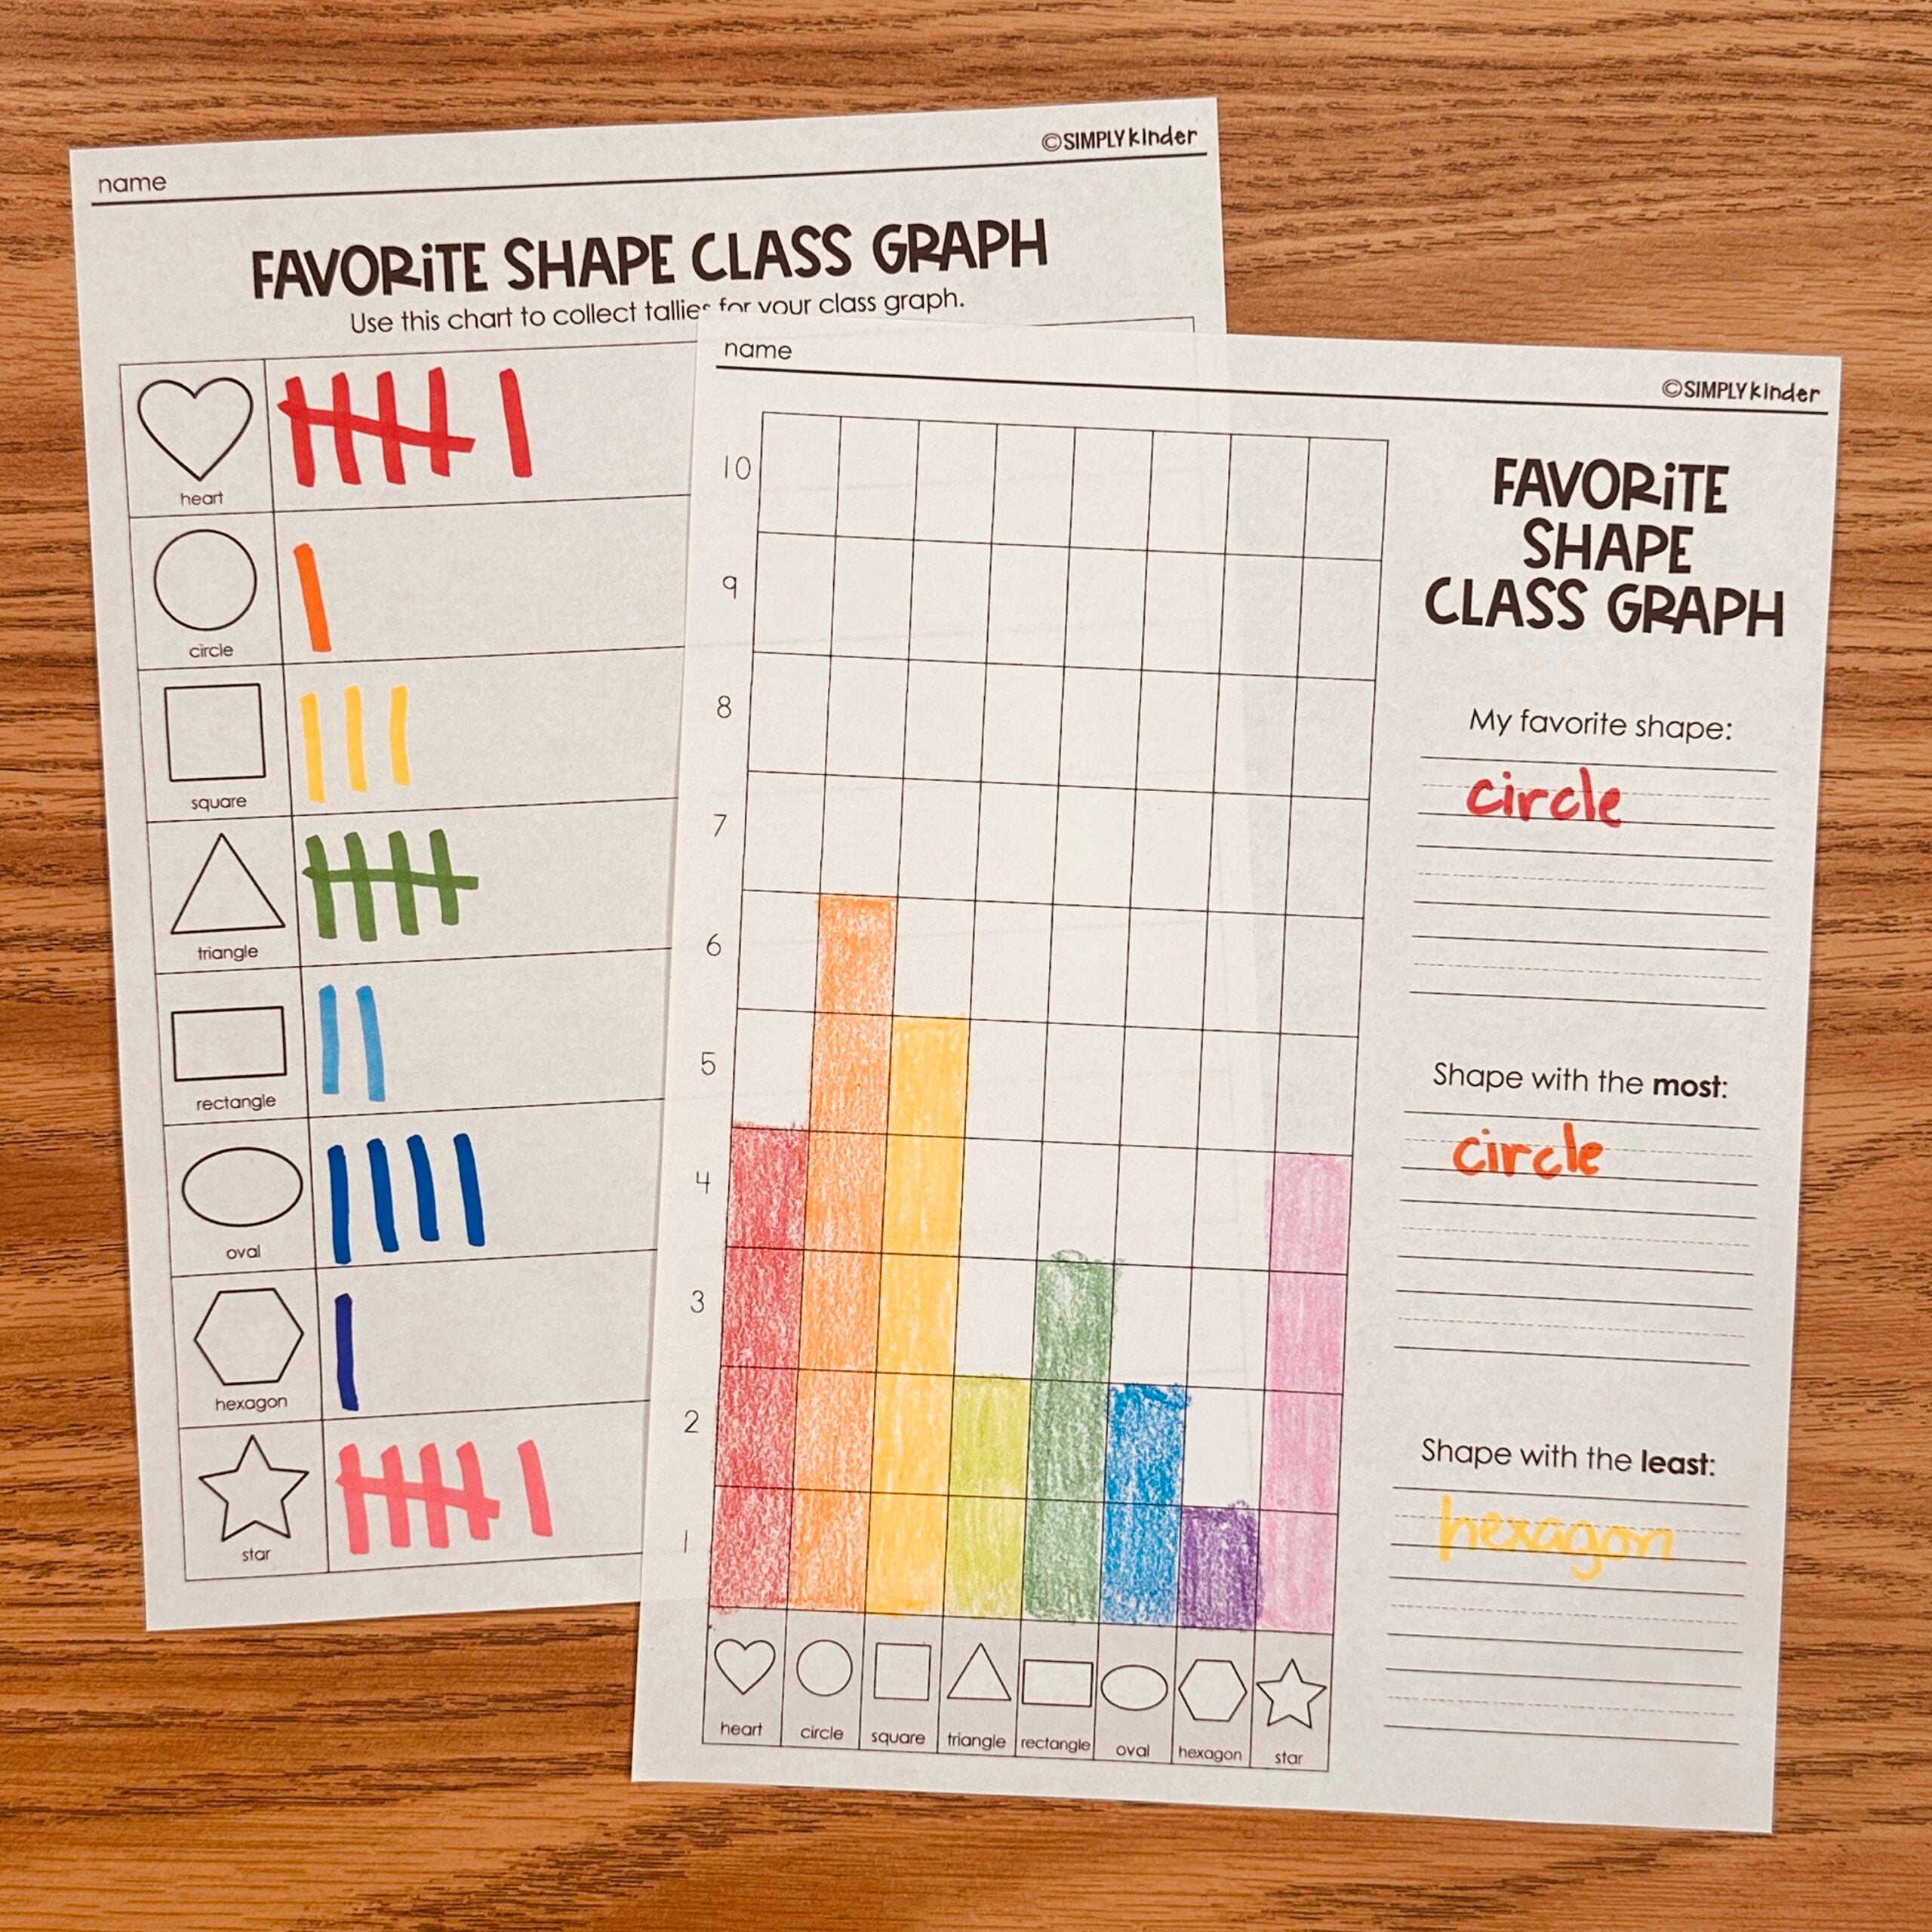
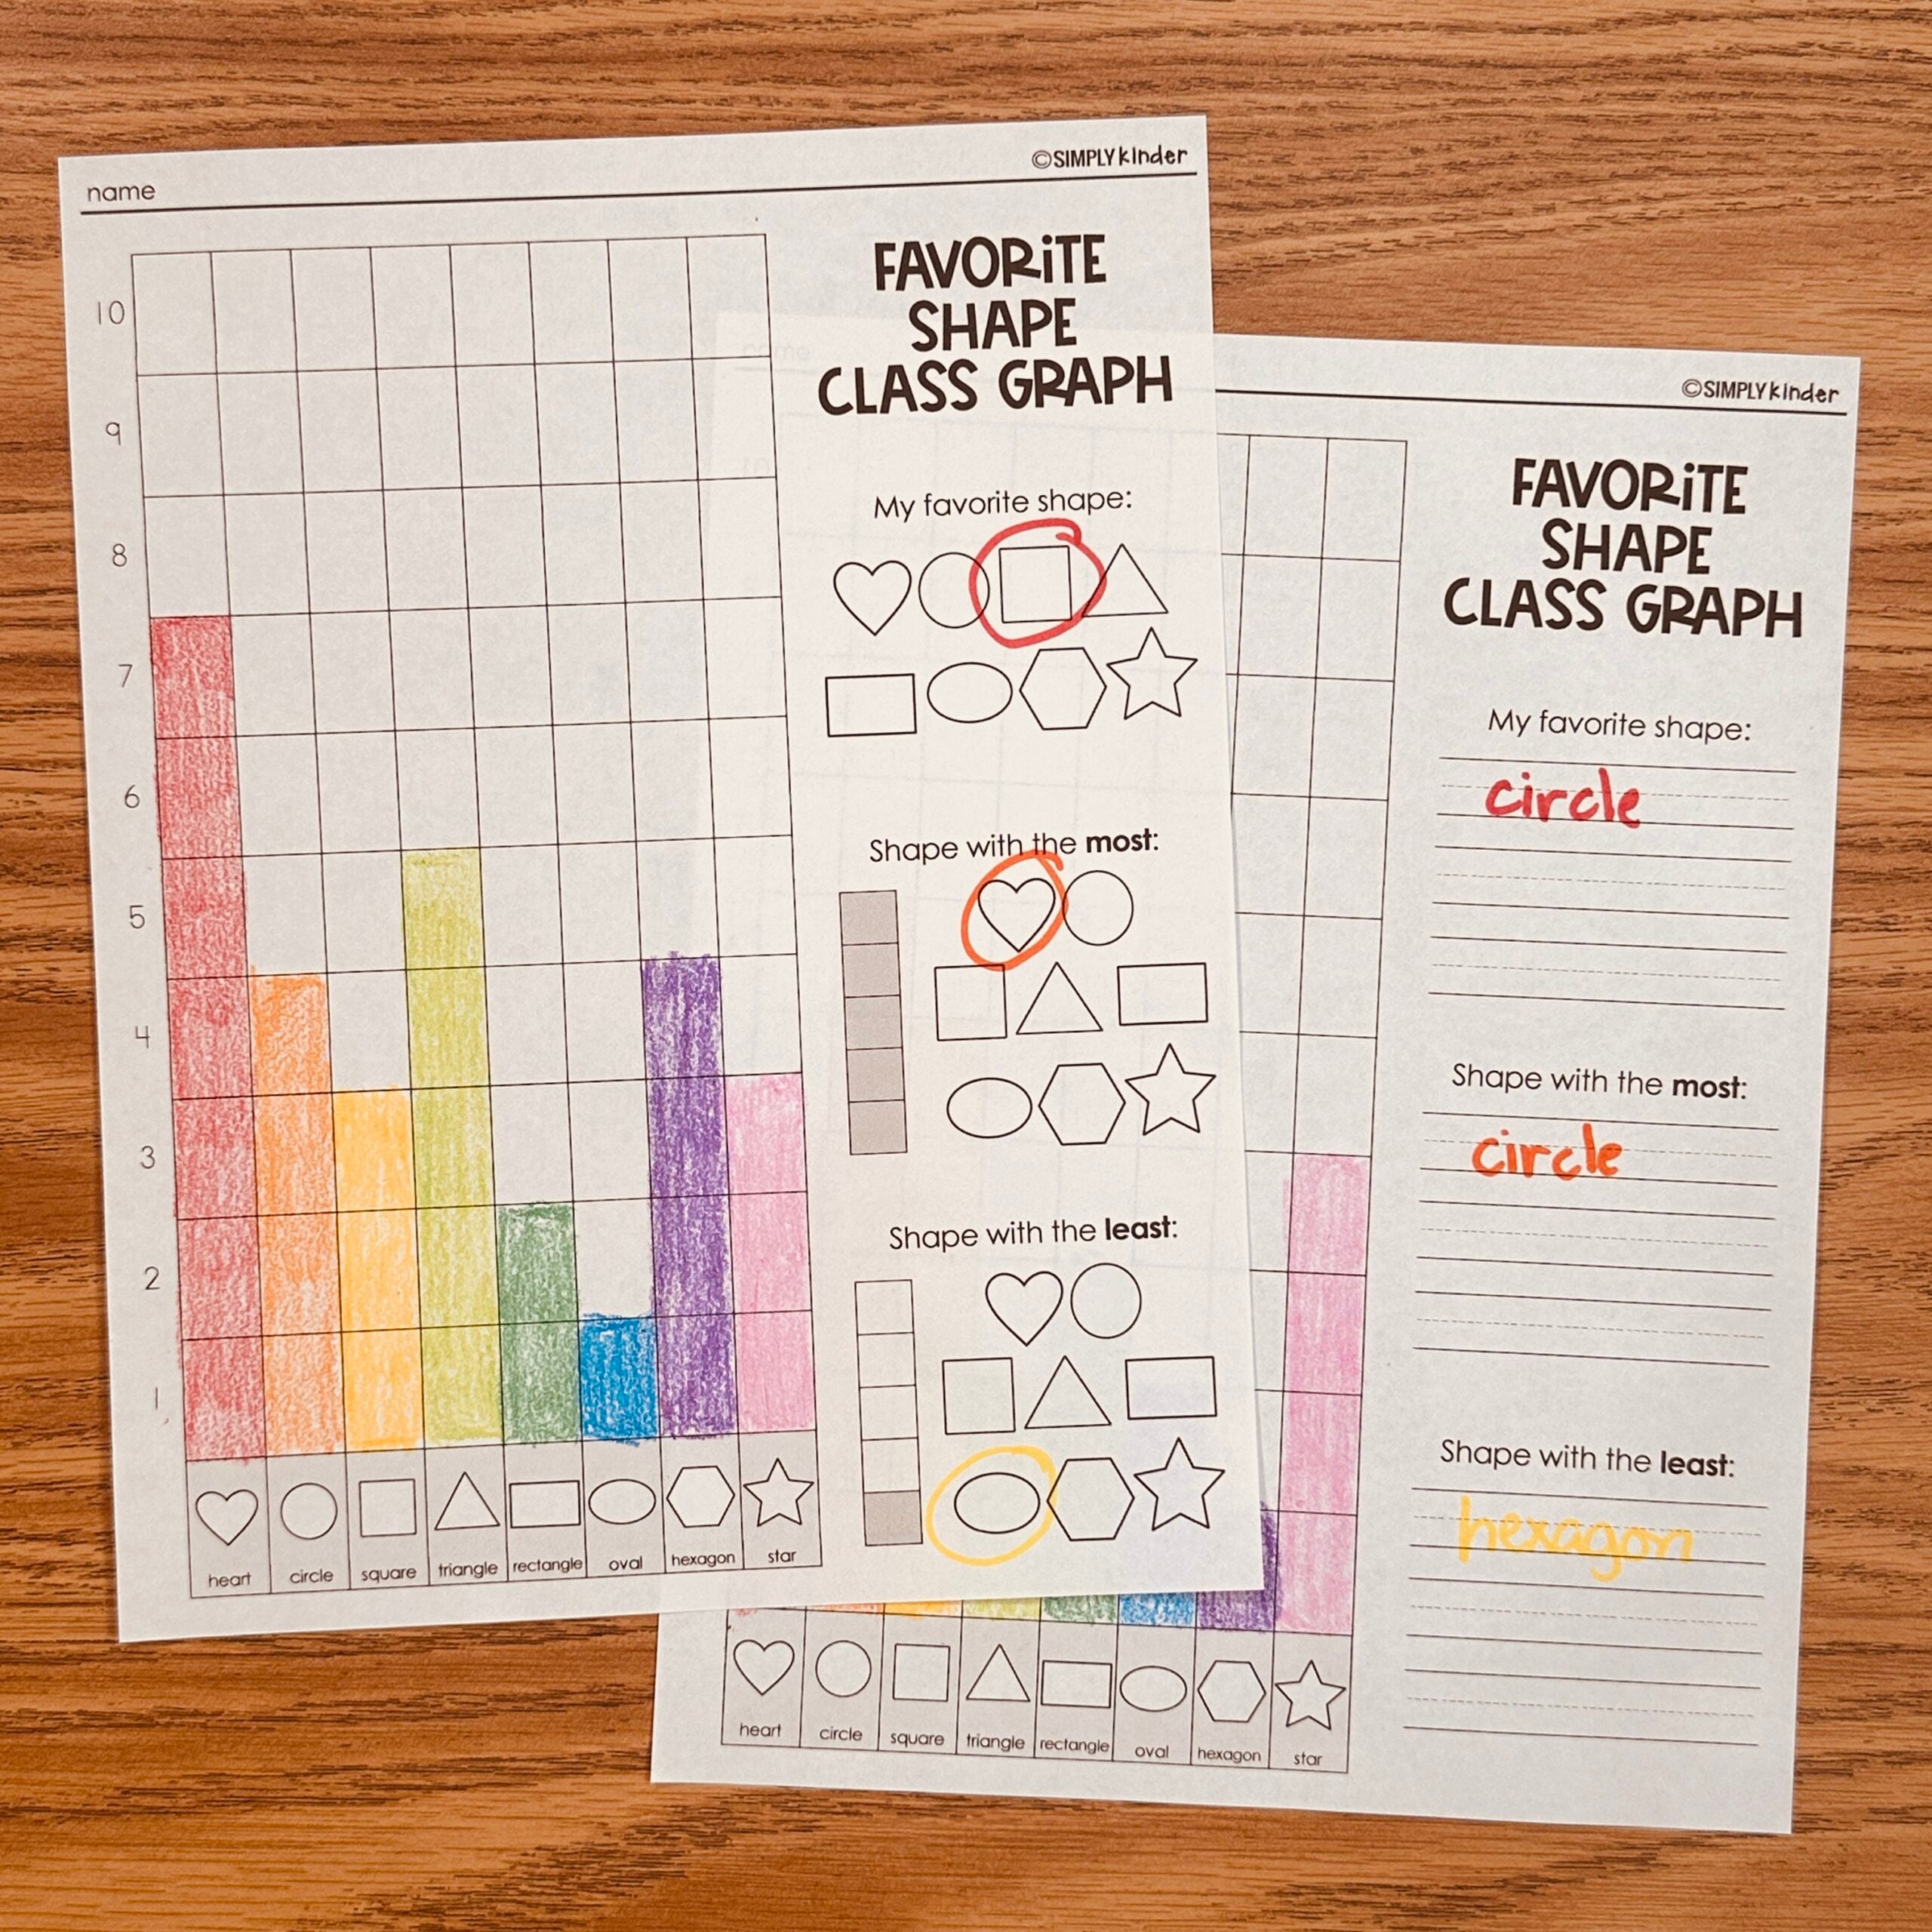
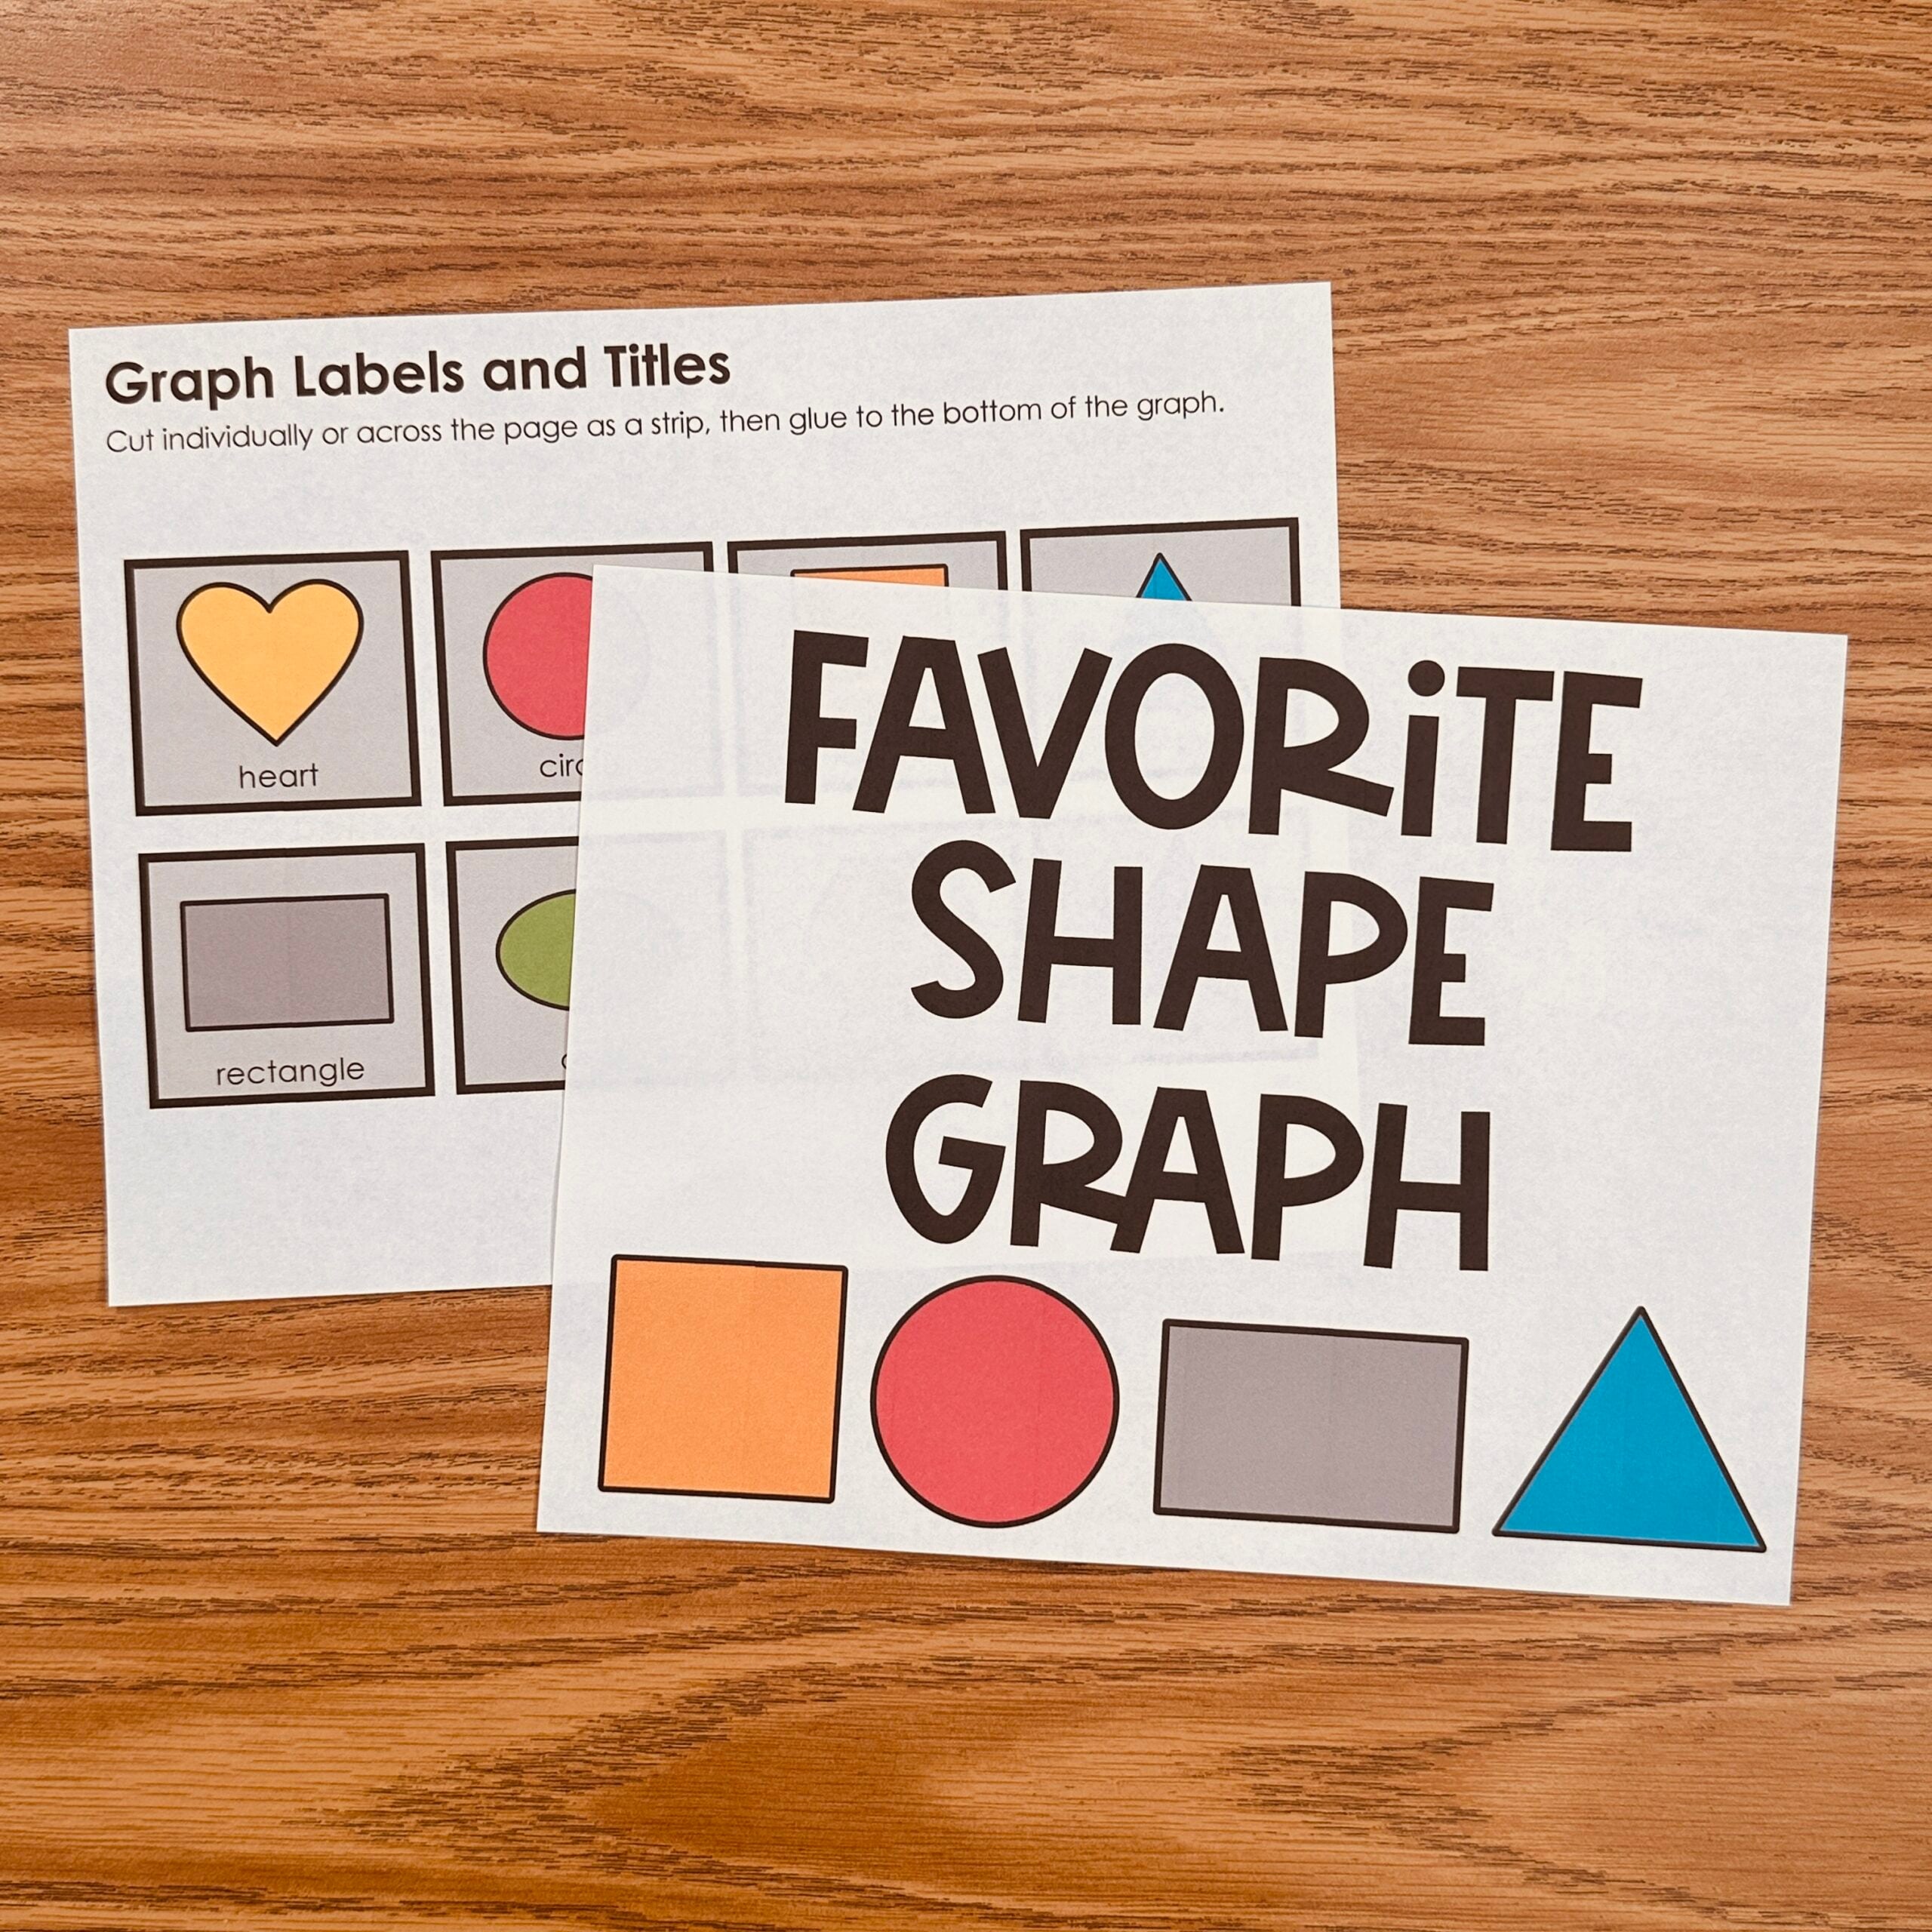
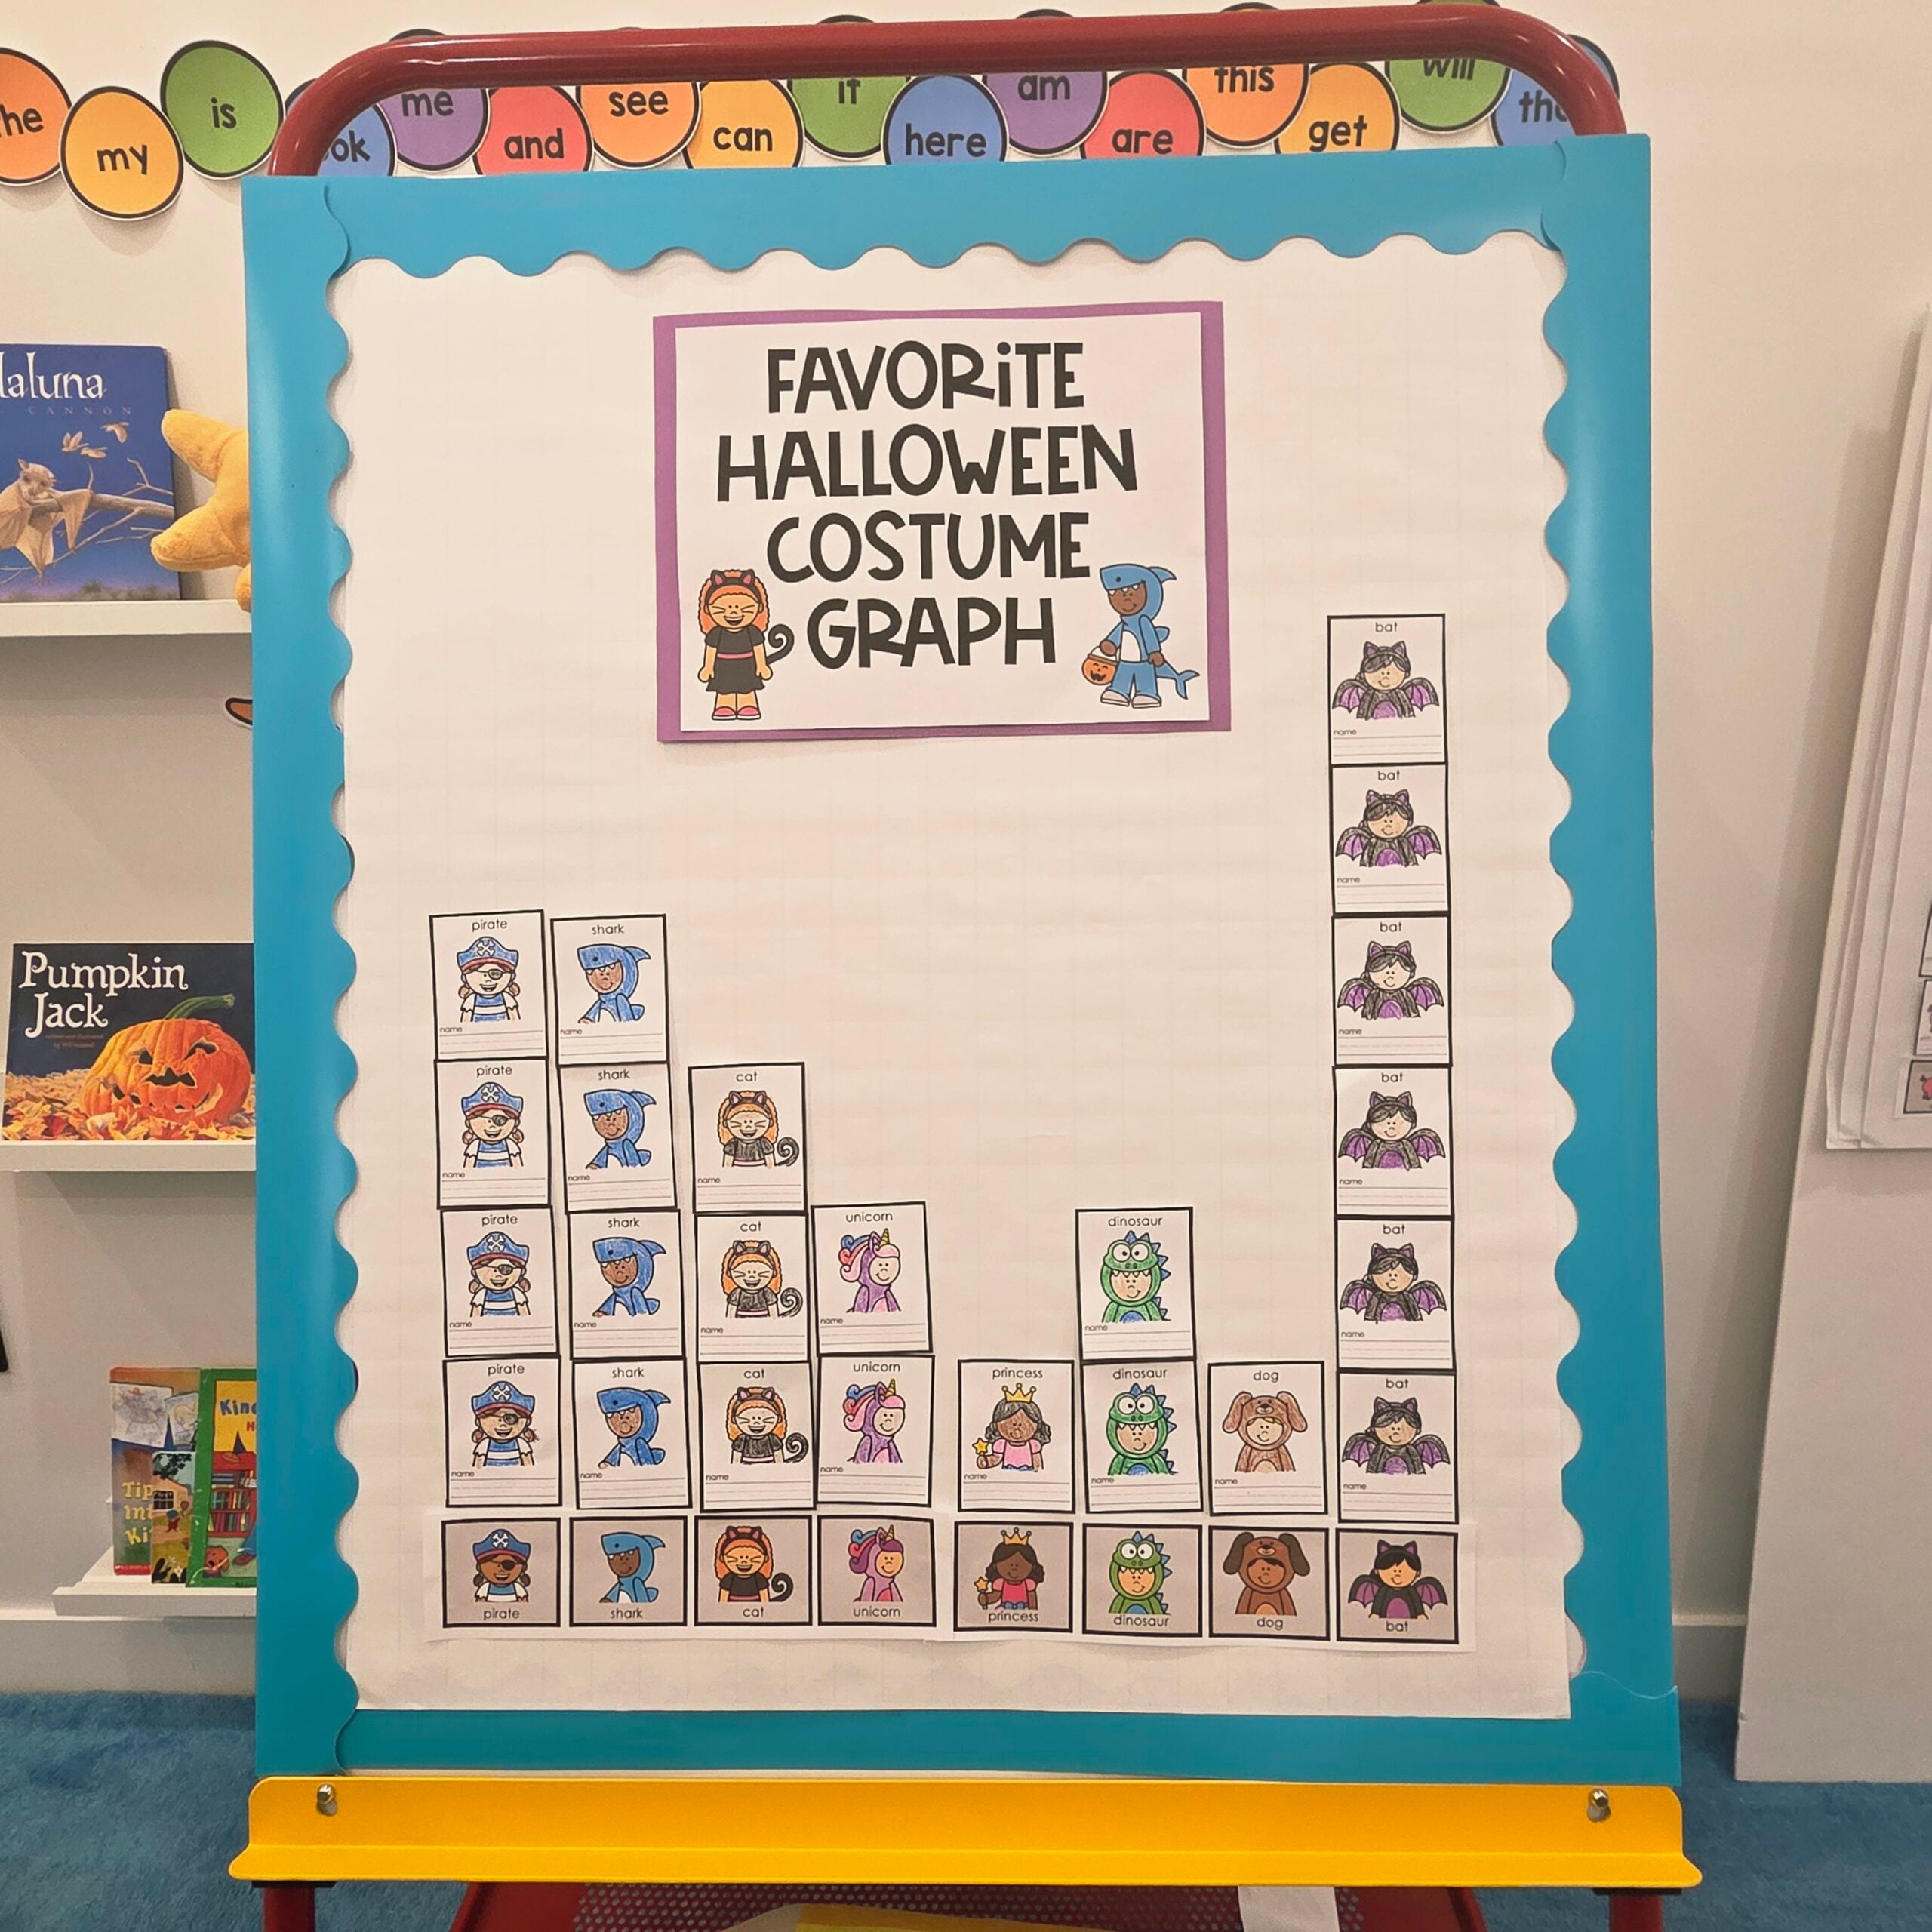
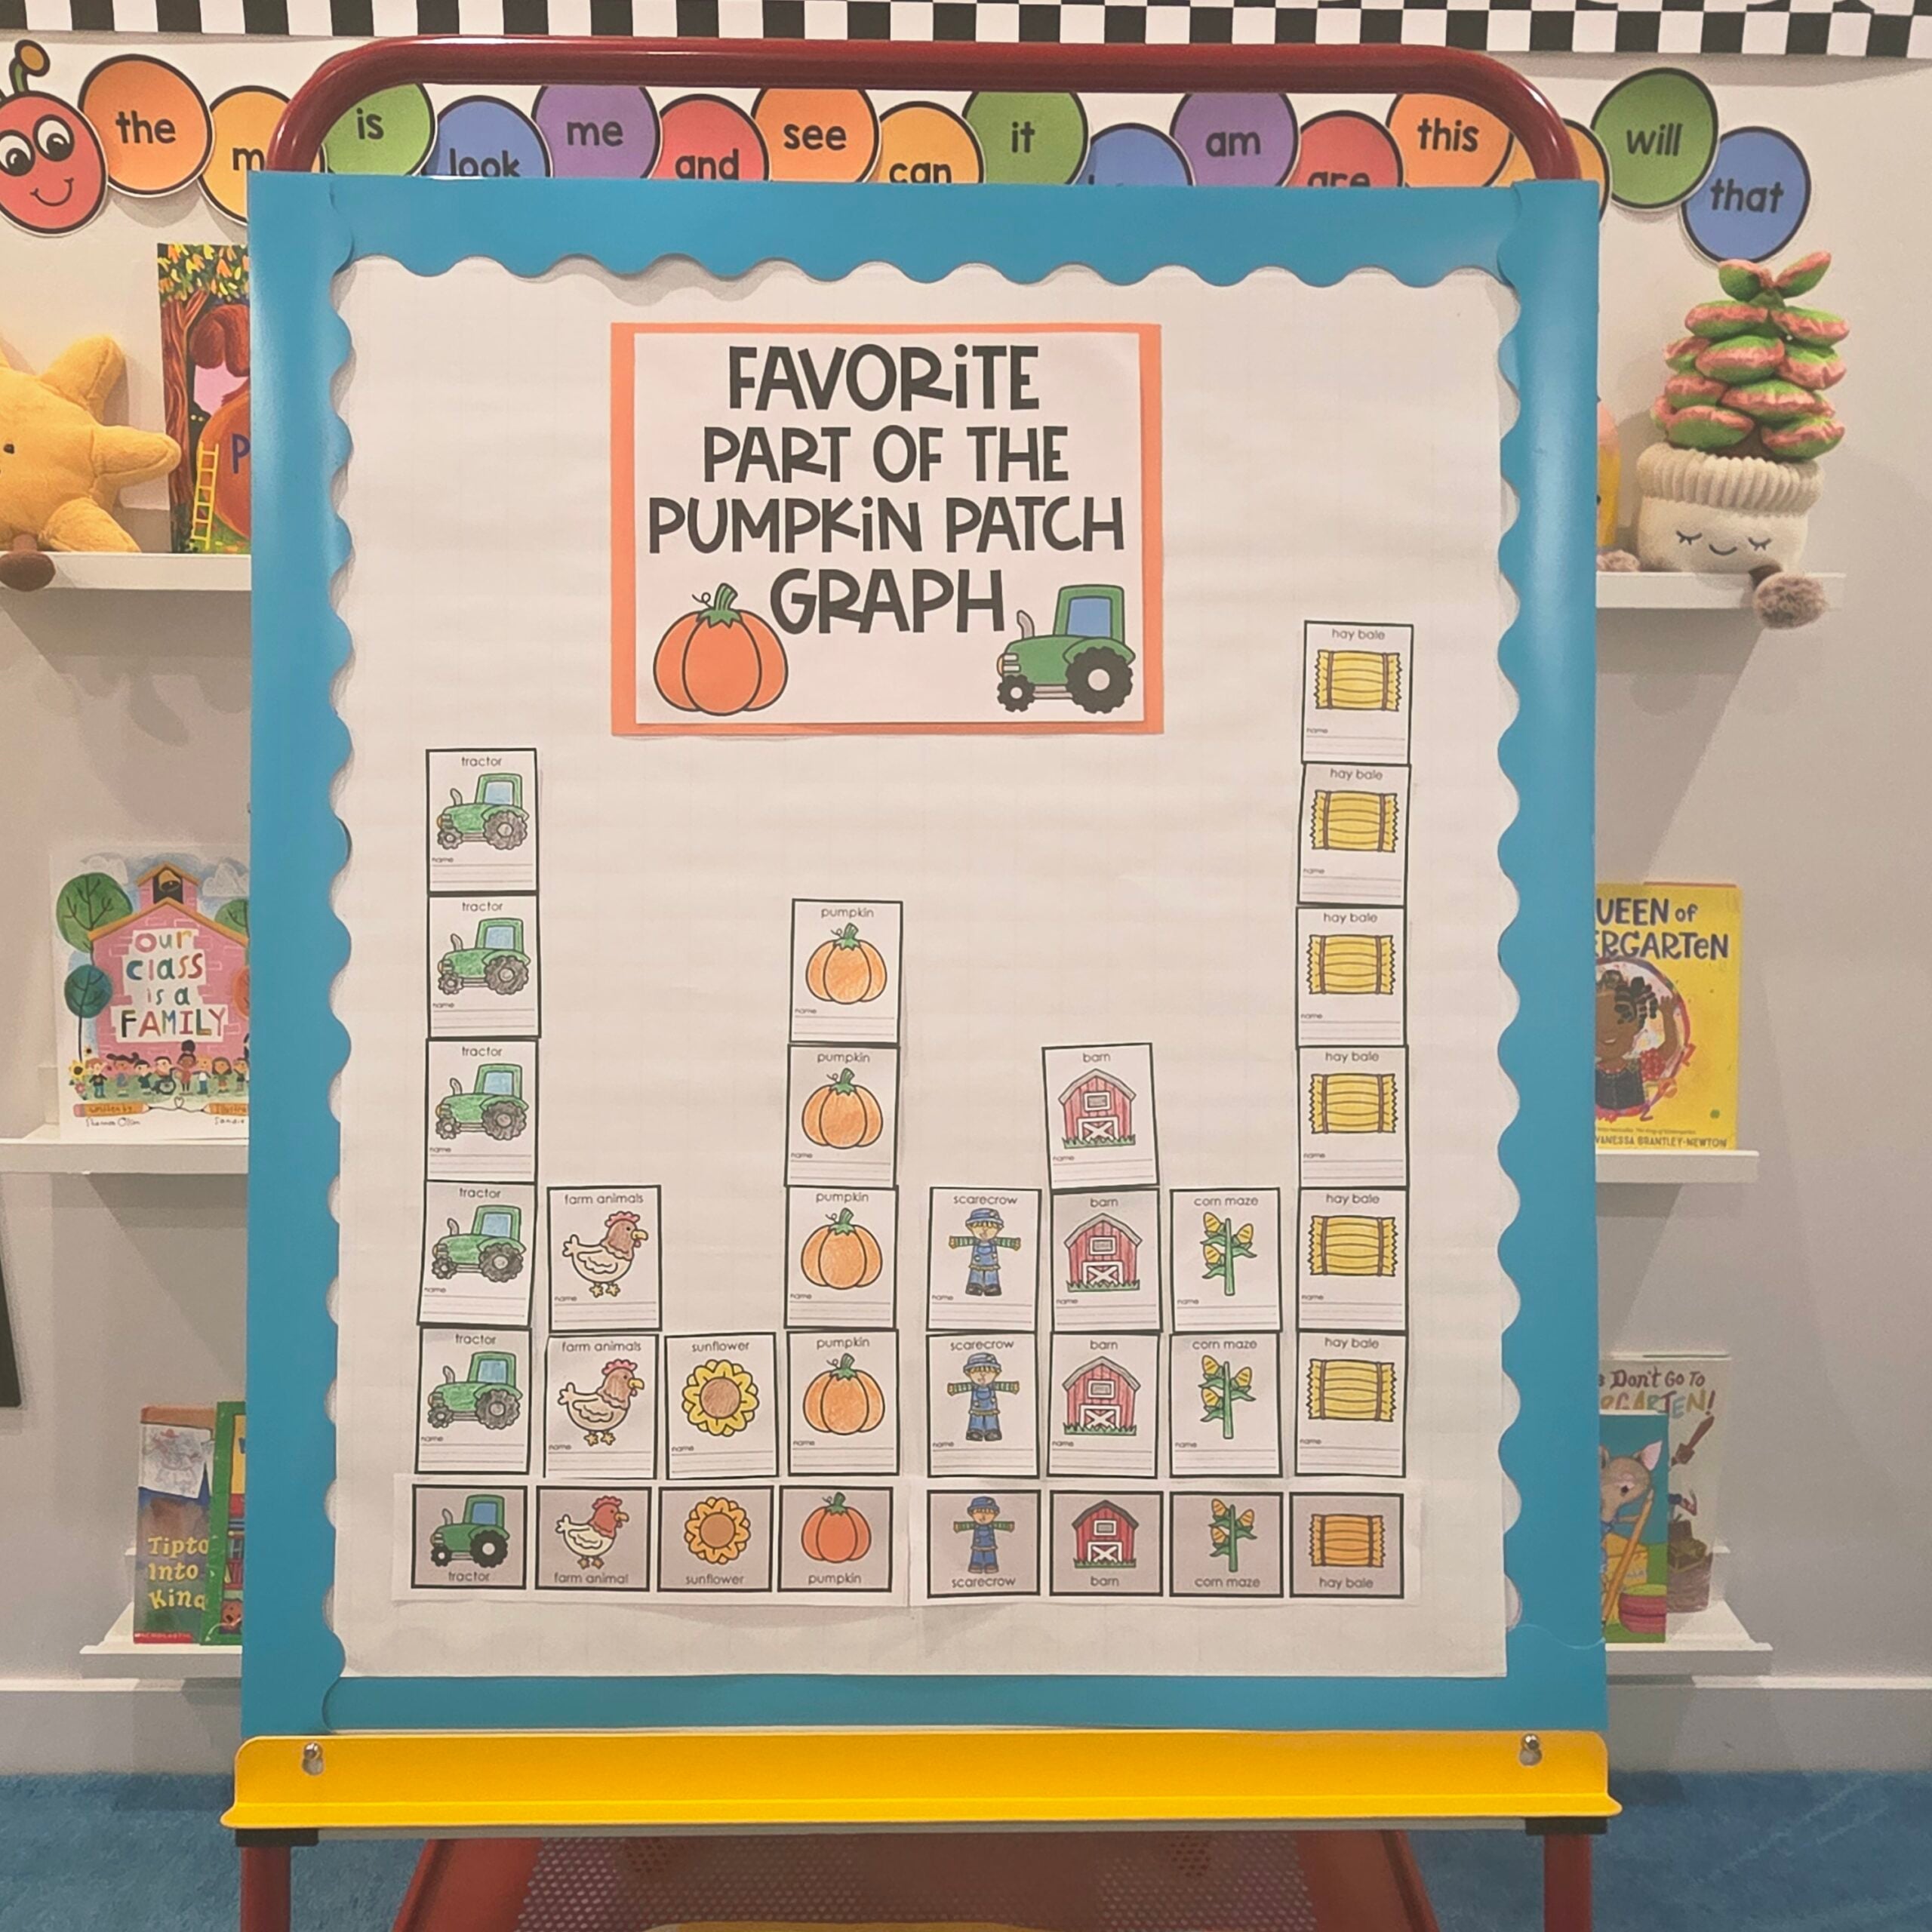
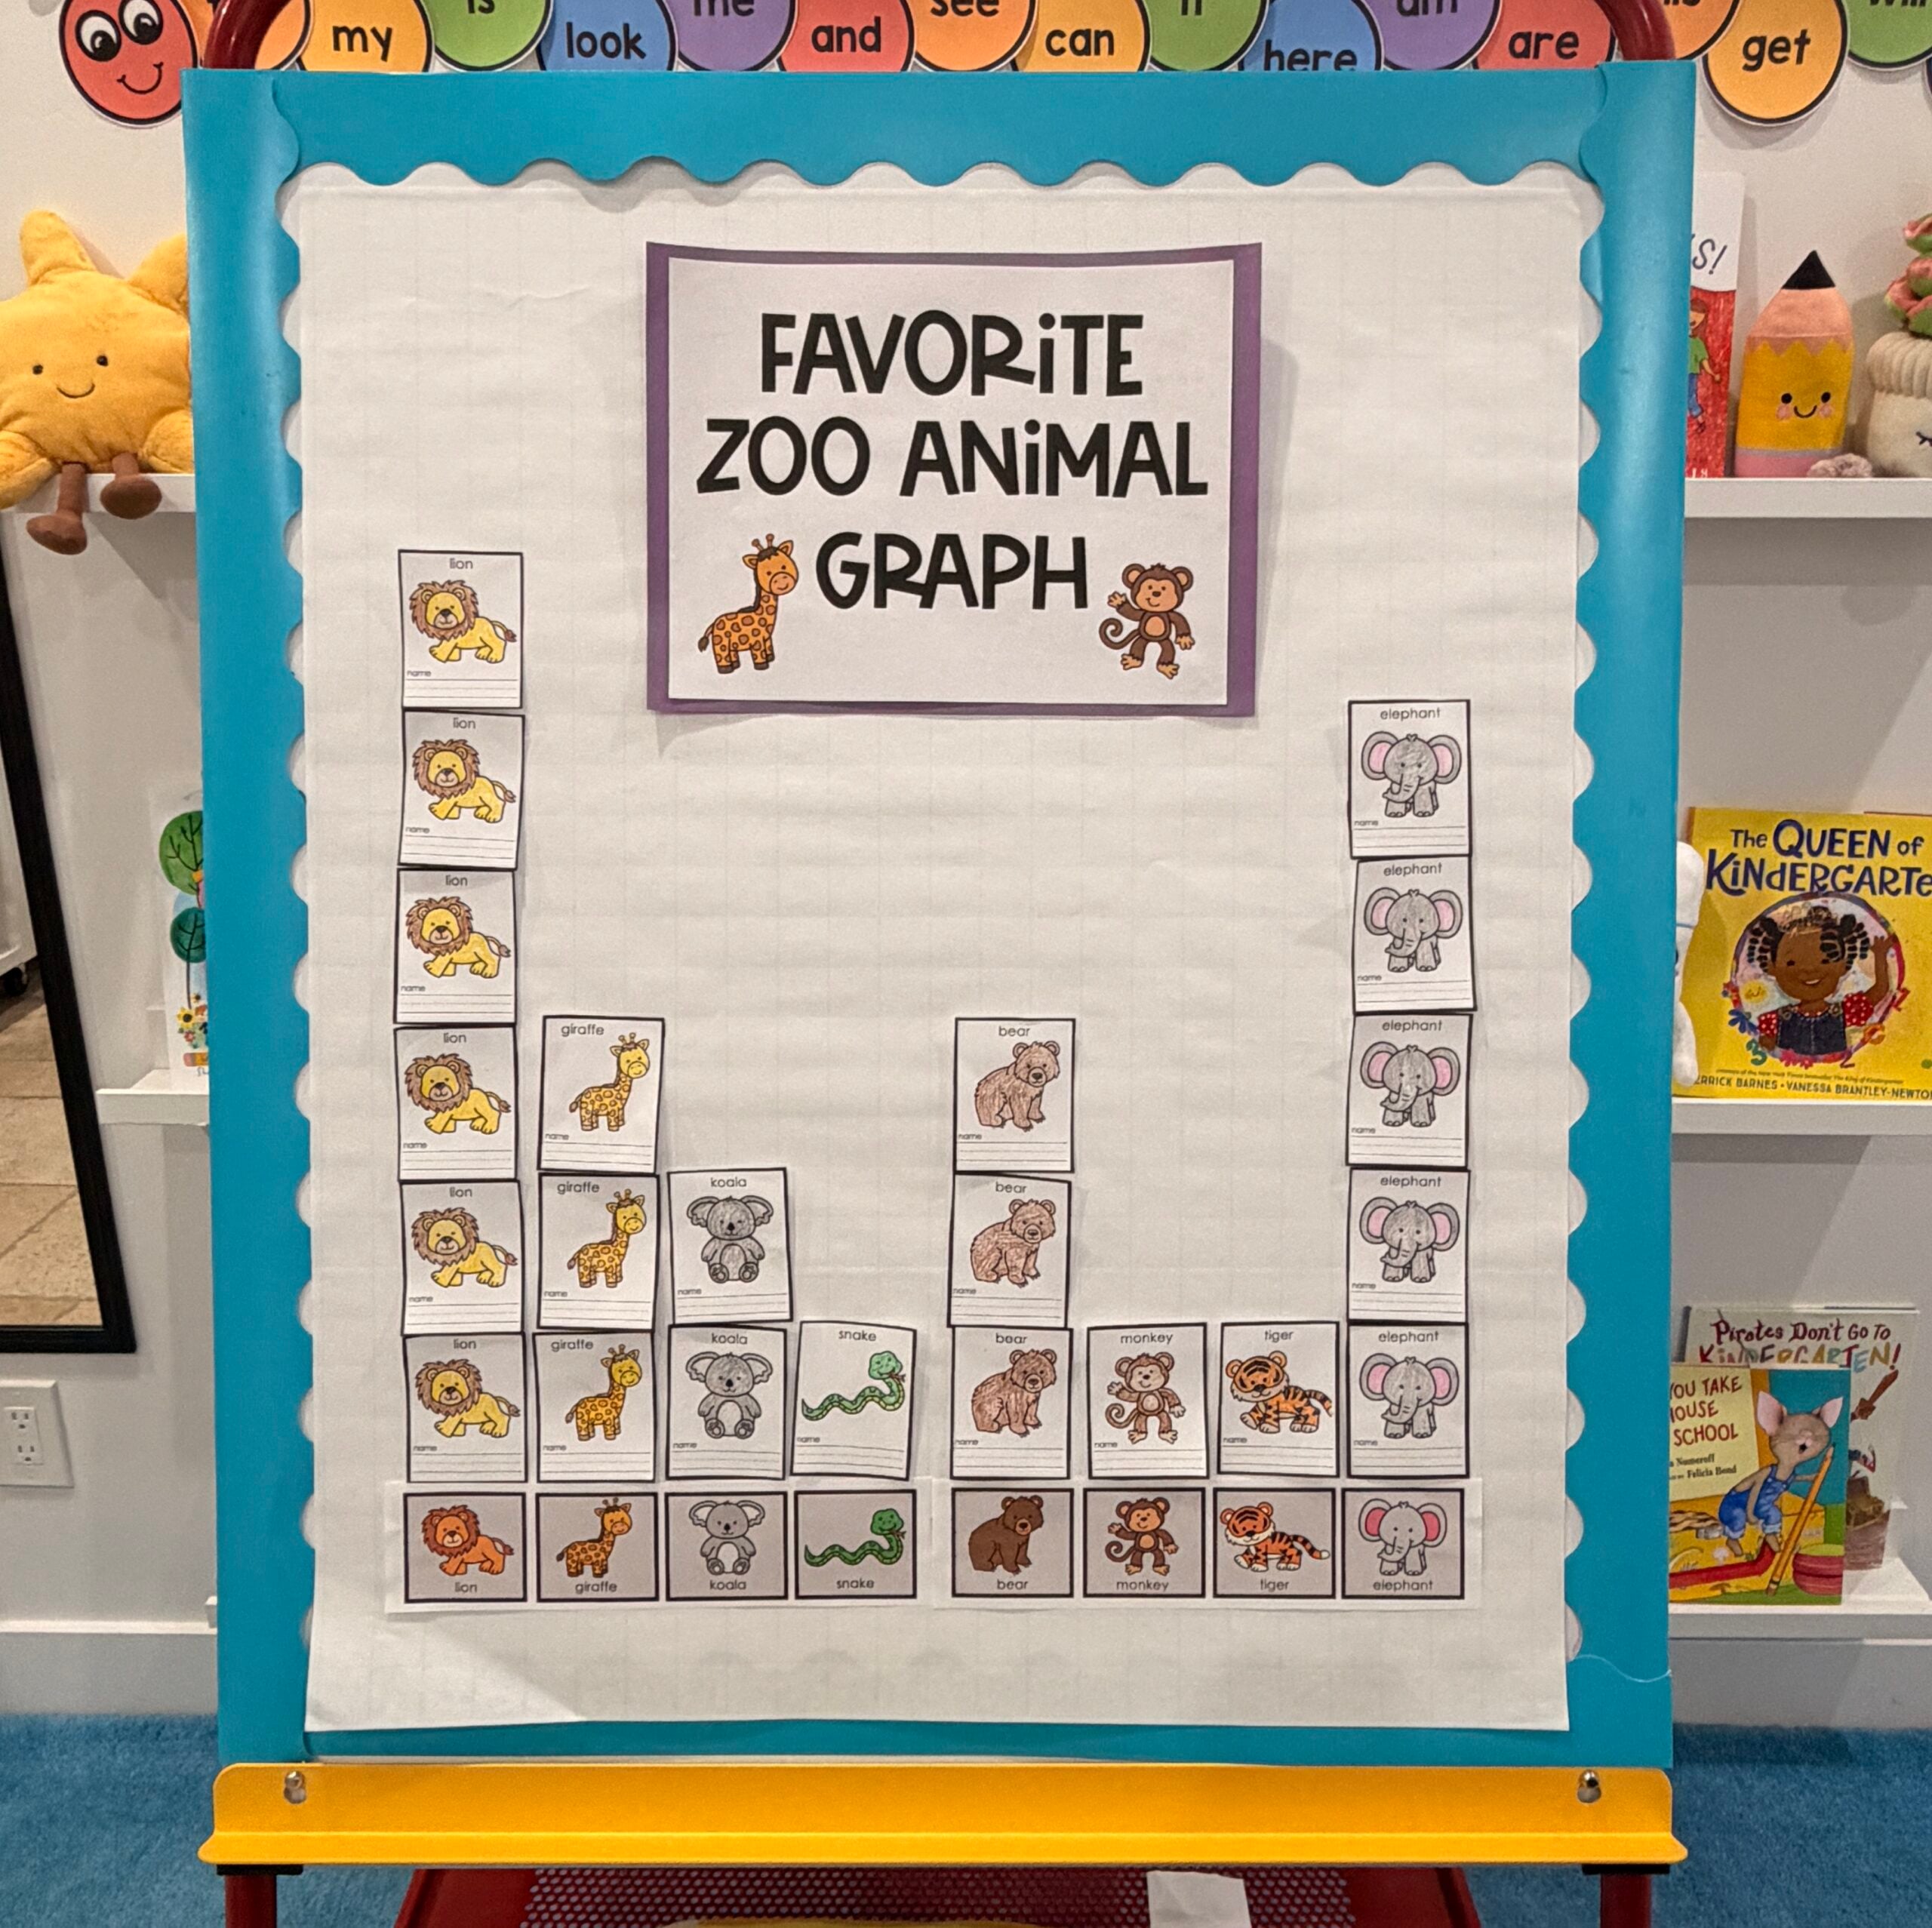
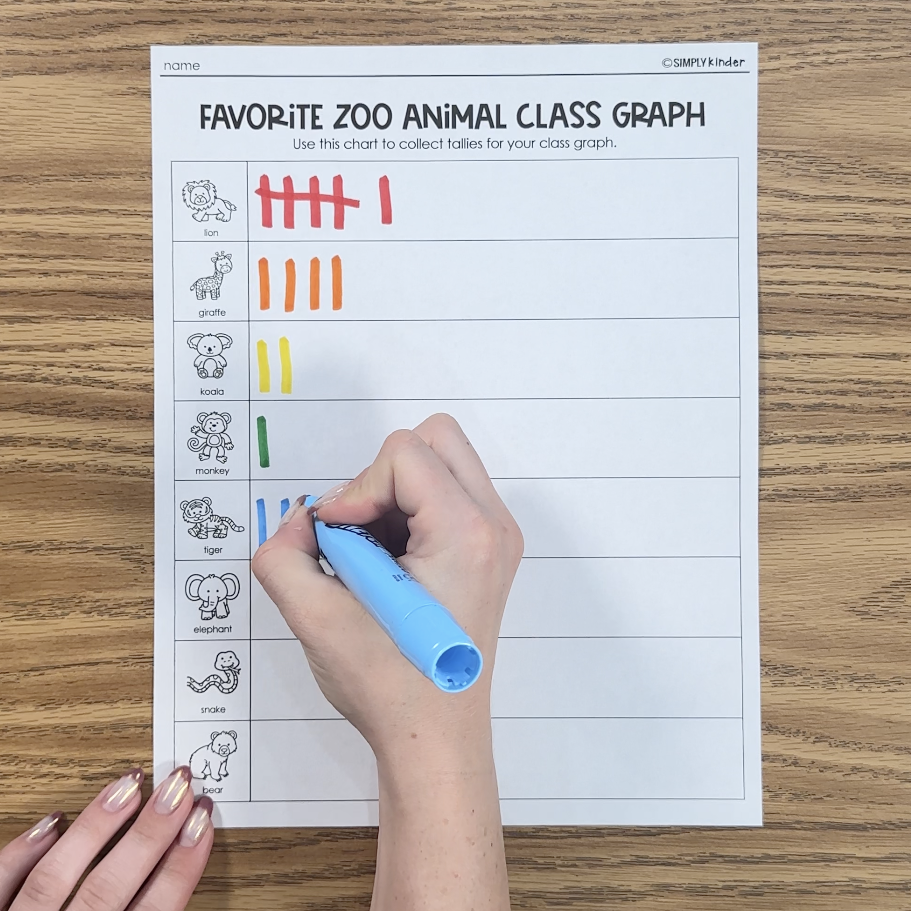
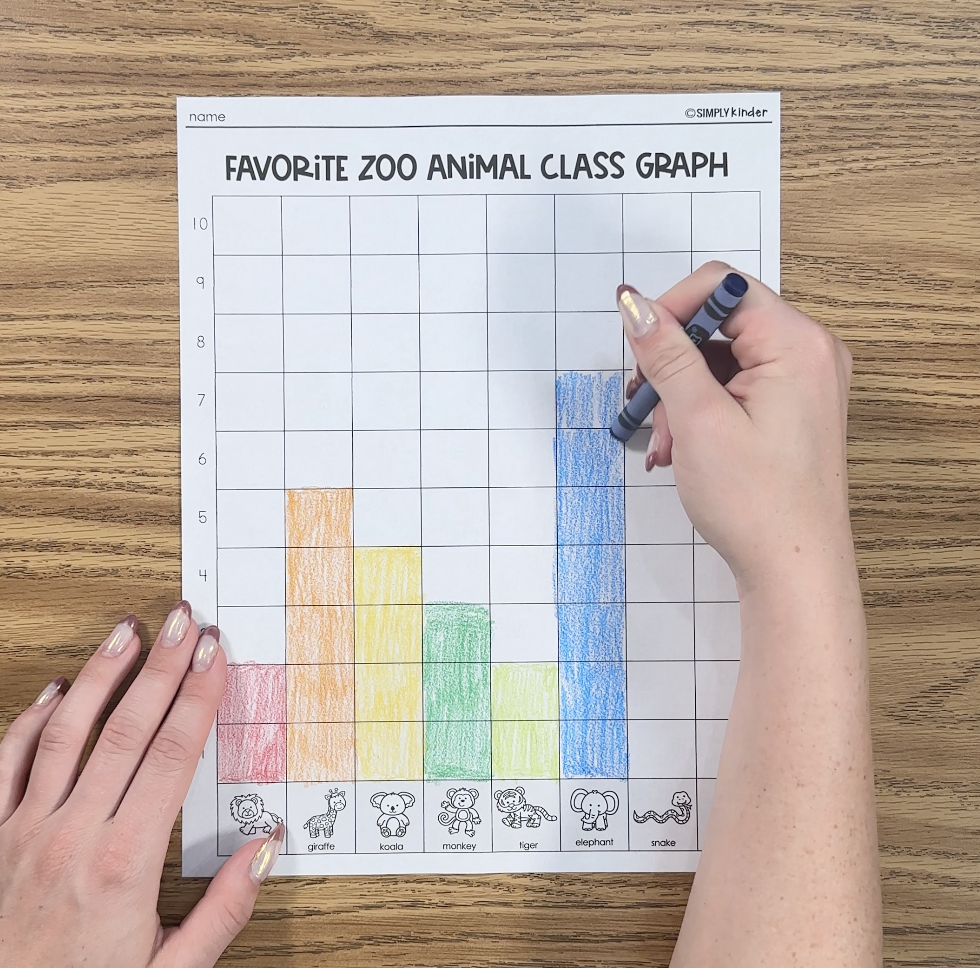
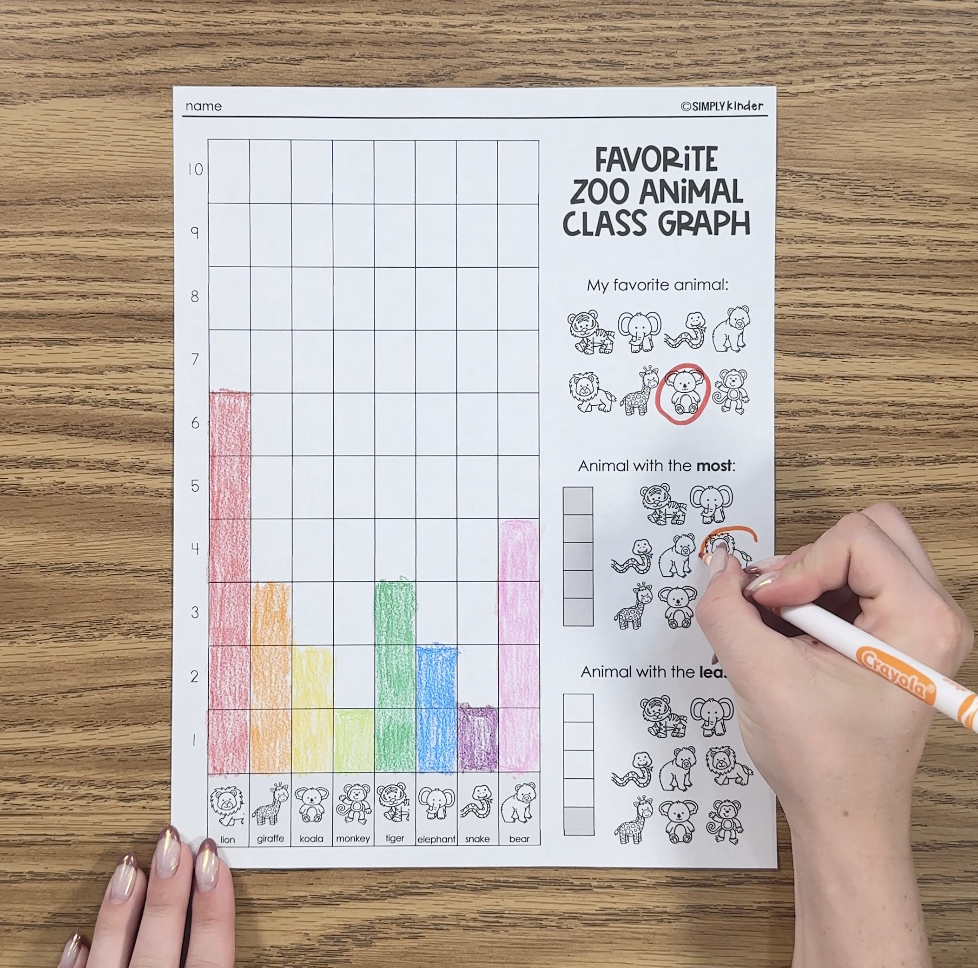
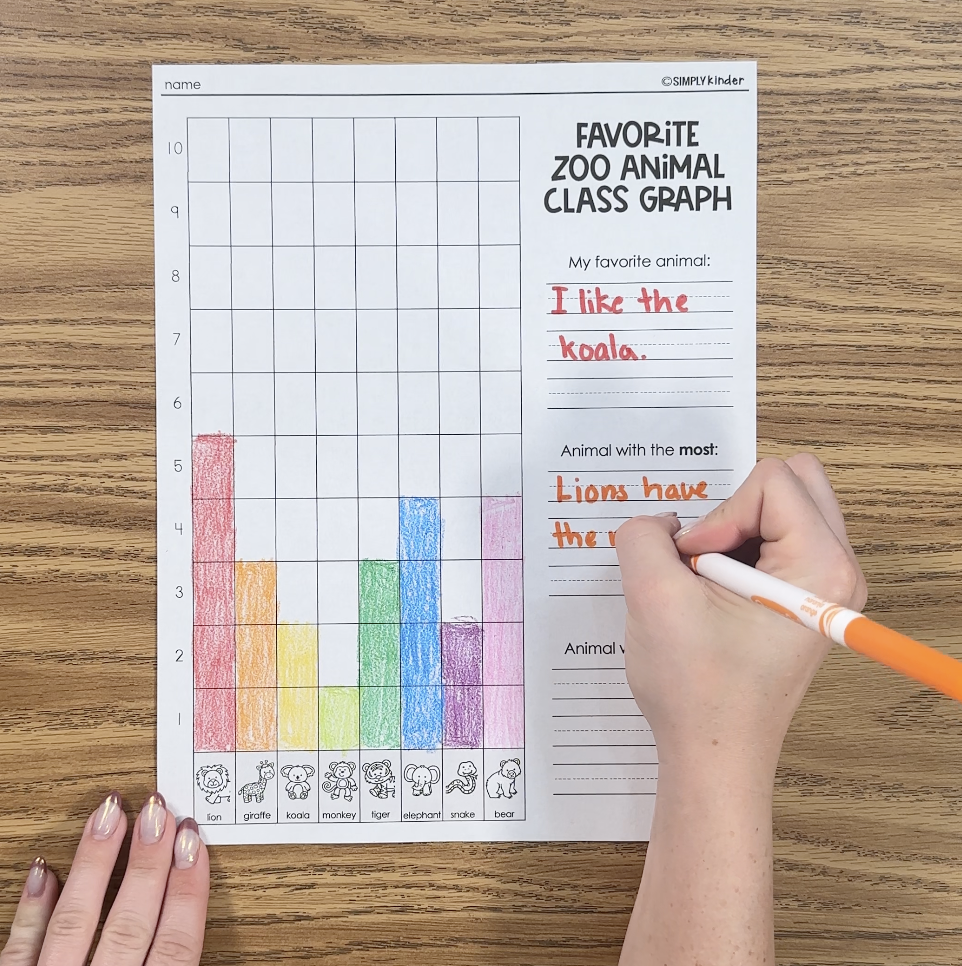
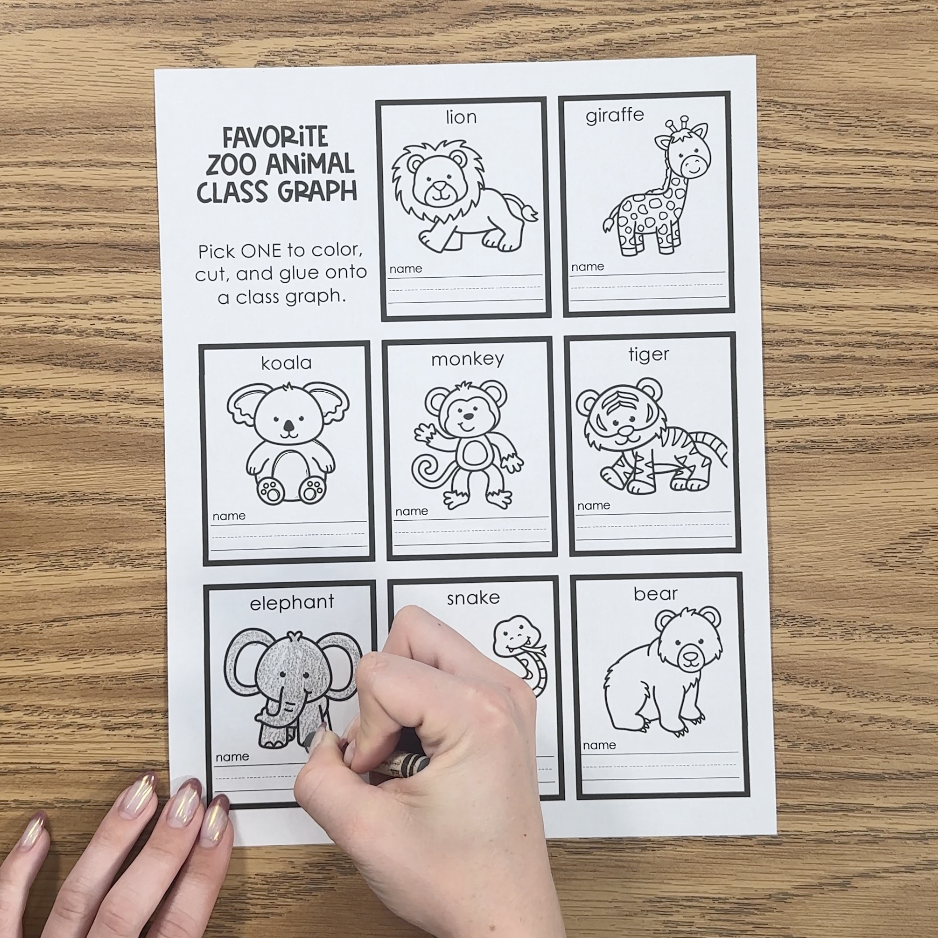
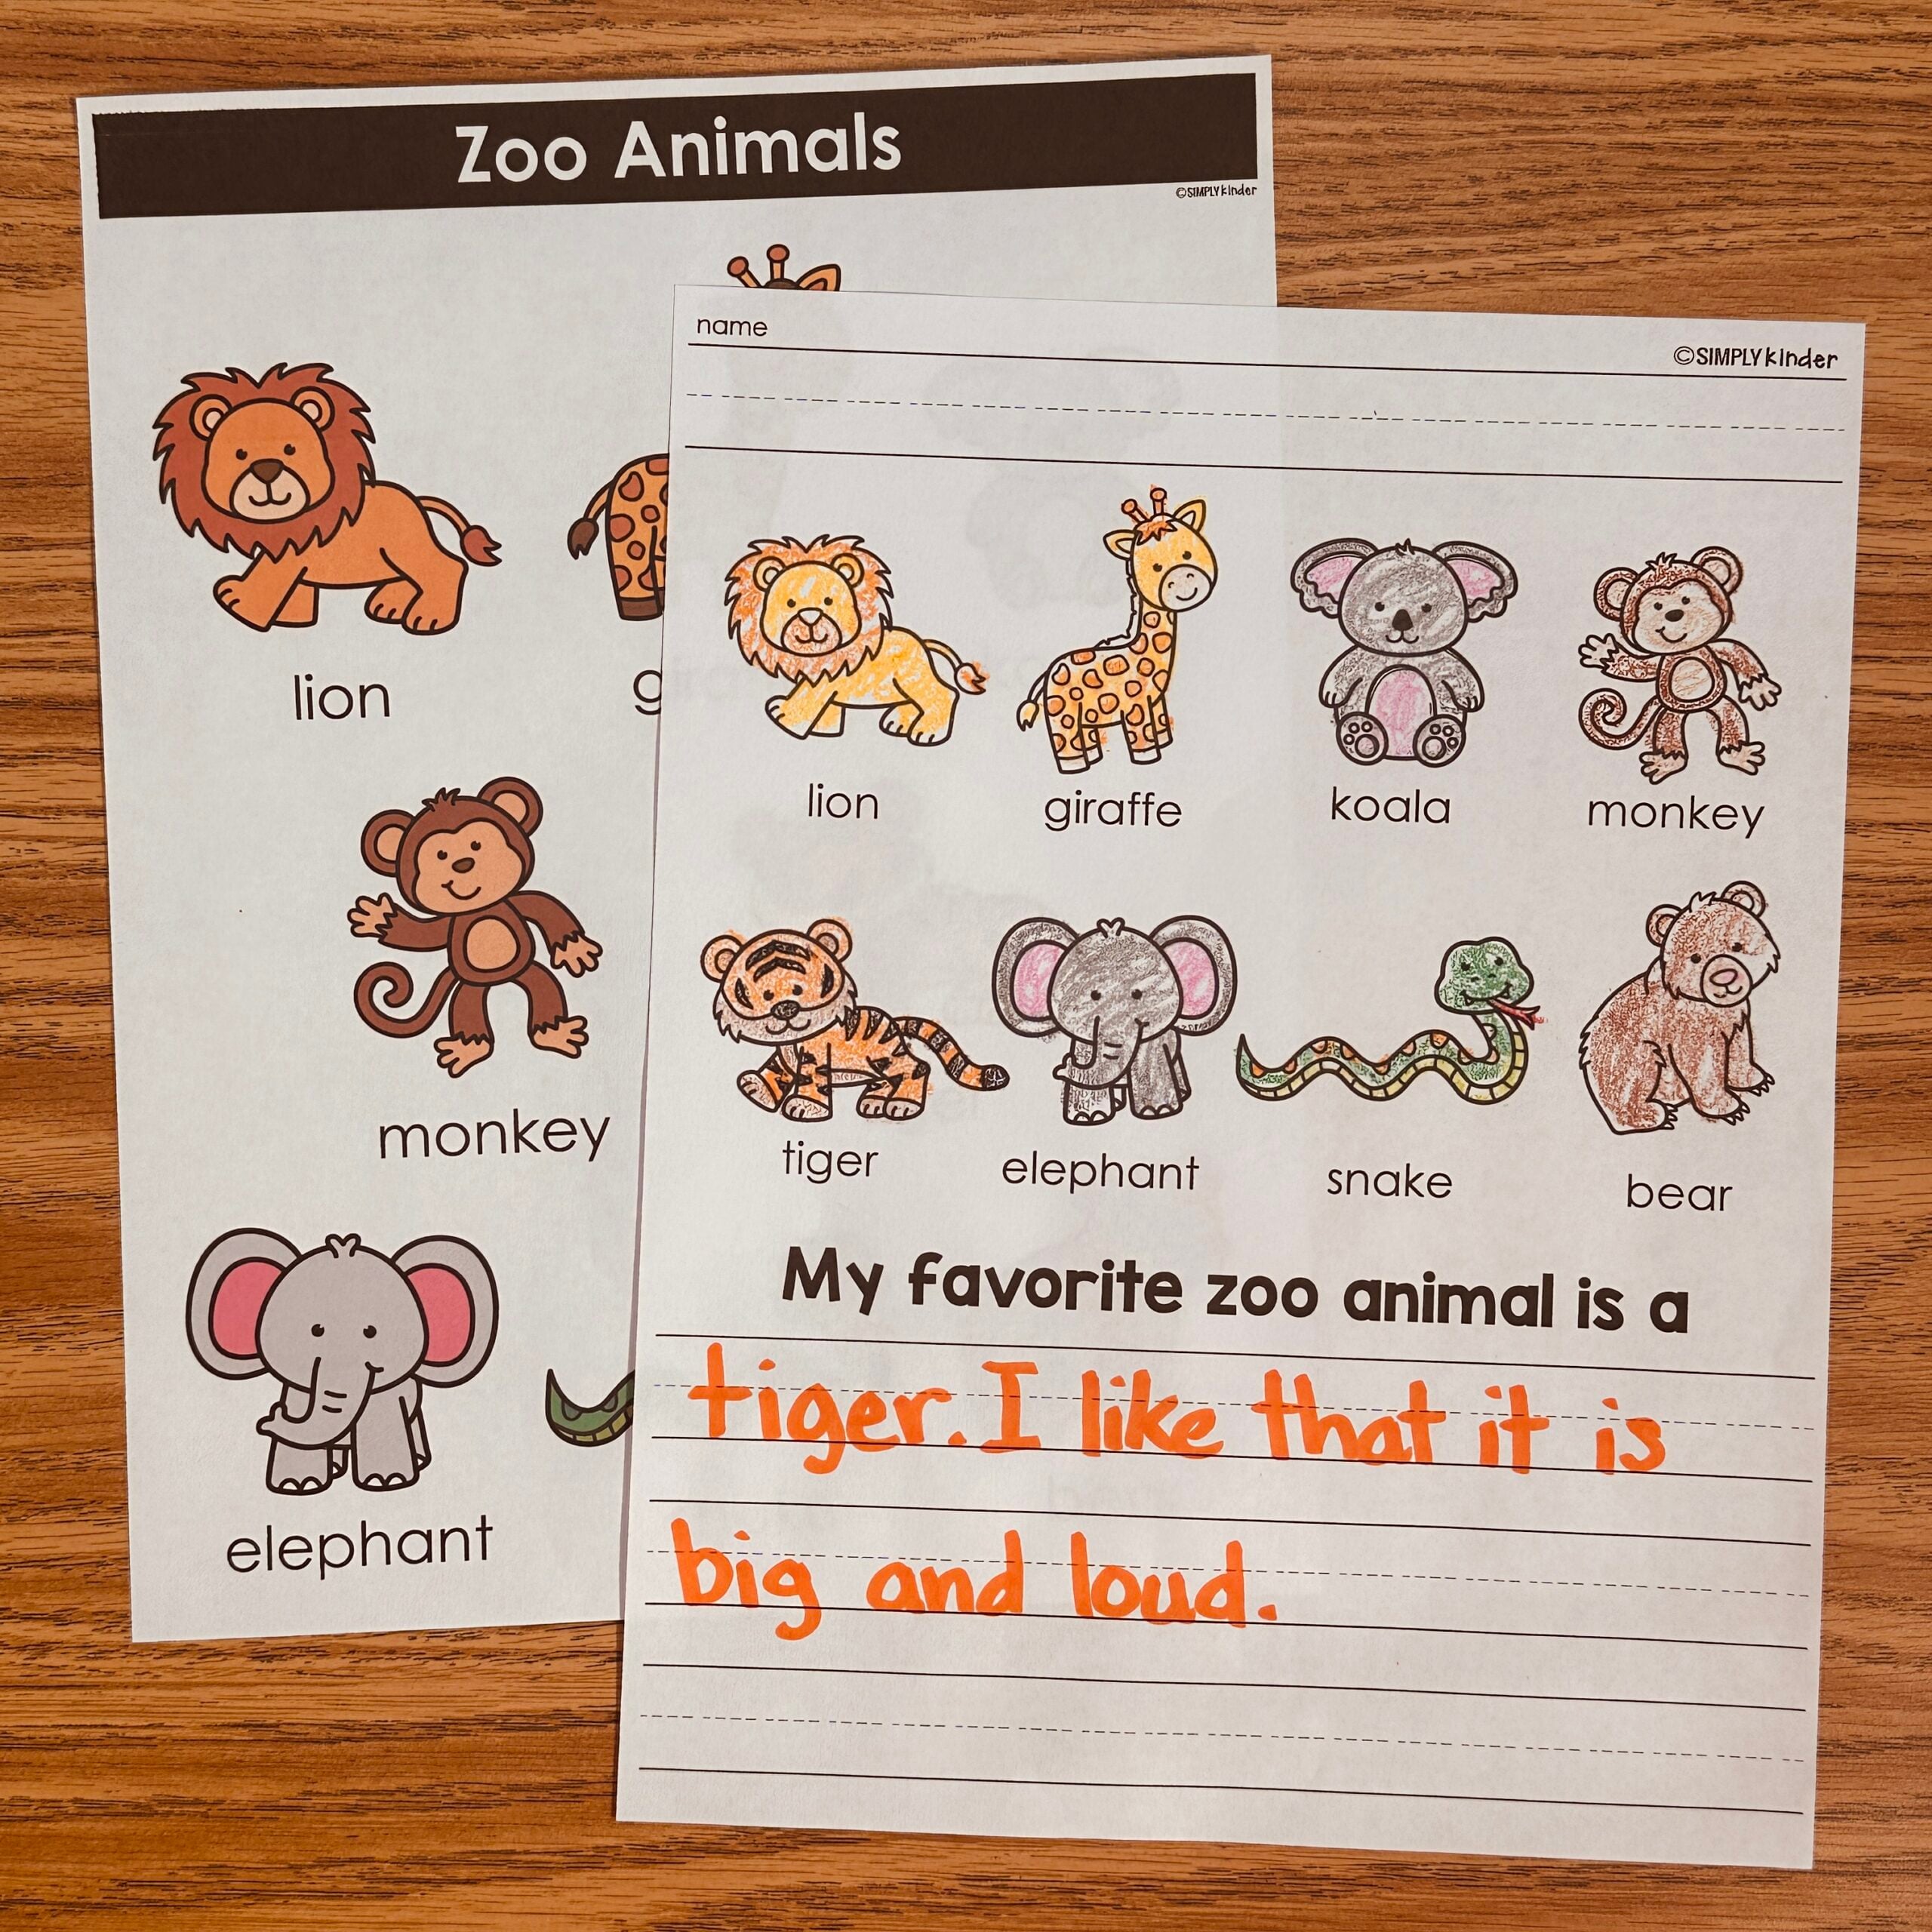
Make graphing meaningful and fun with this Zoo Animals Class Graph! Students choose their favorite zoo animal, add their choice to a whole-class graph, collect and present the data, and then create their own graph to show the results. With a matching tally chart, vocabulary pages, and reflection printables, students get hands-on practice with graphing, data collection, most, least, more, fewer, and equal.
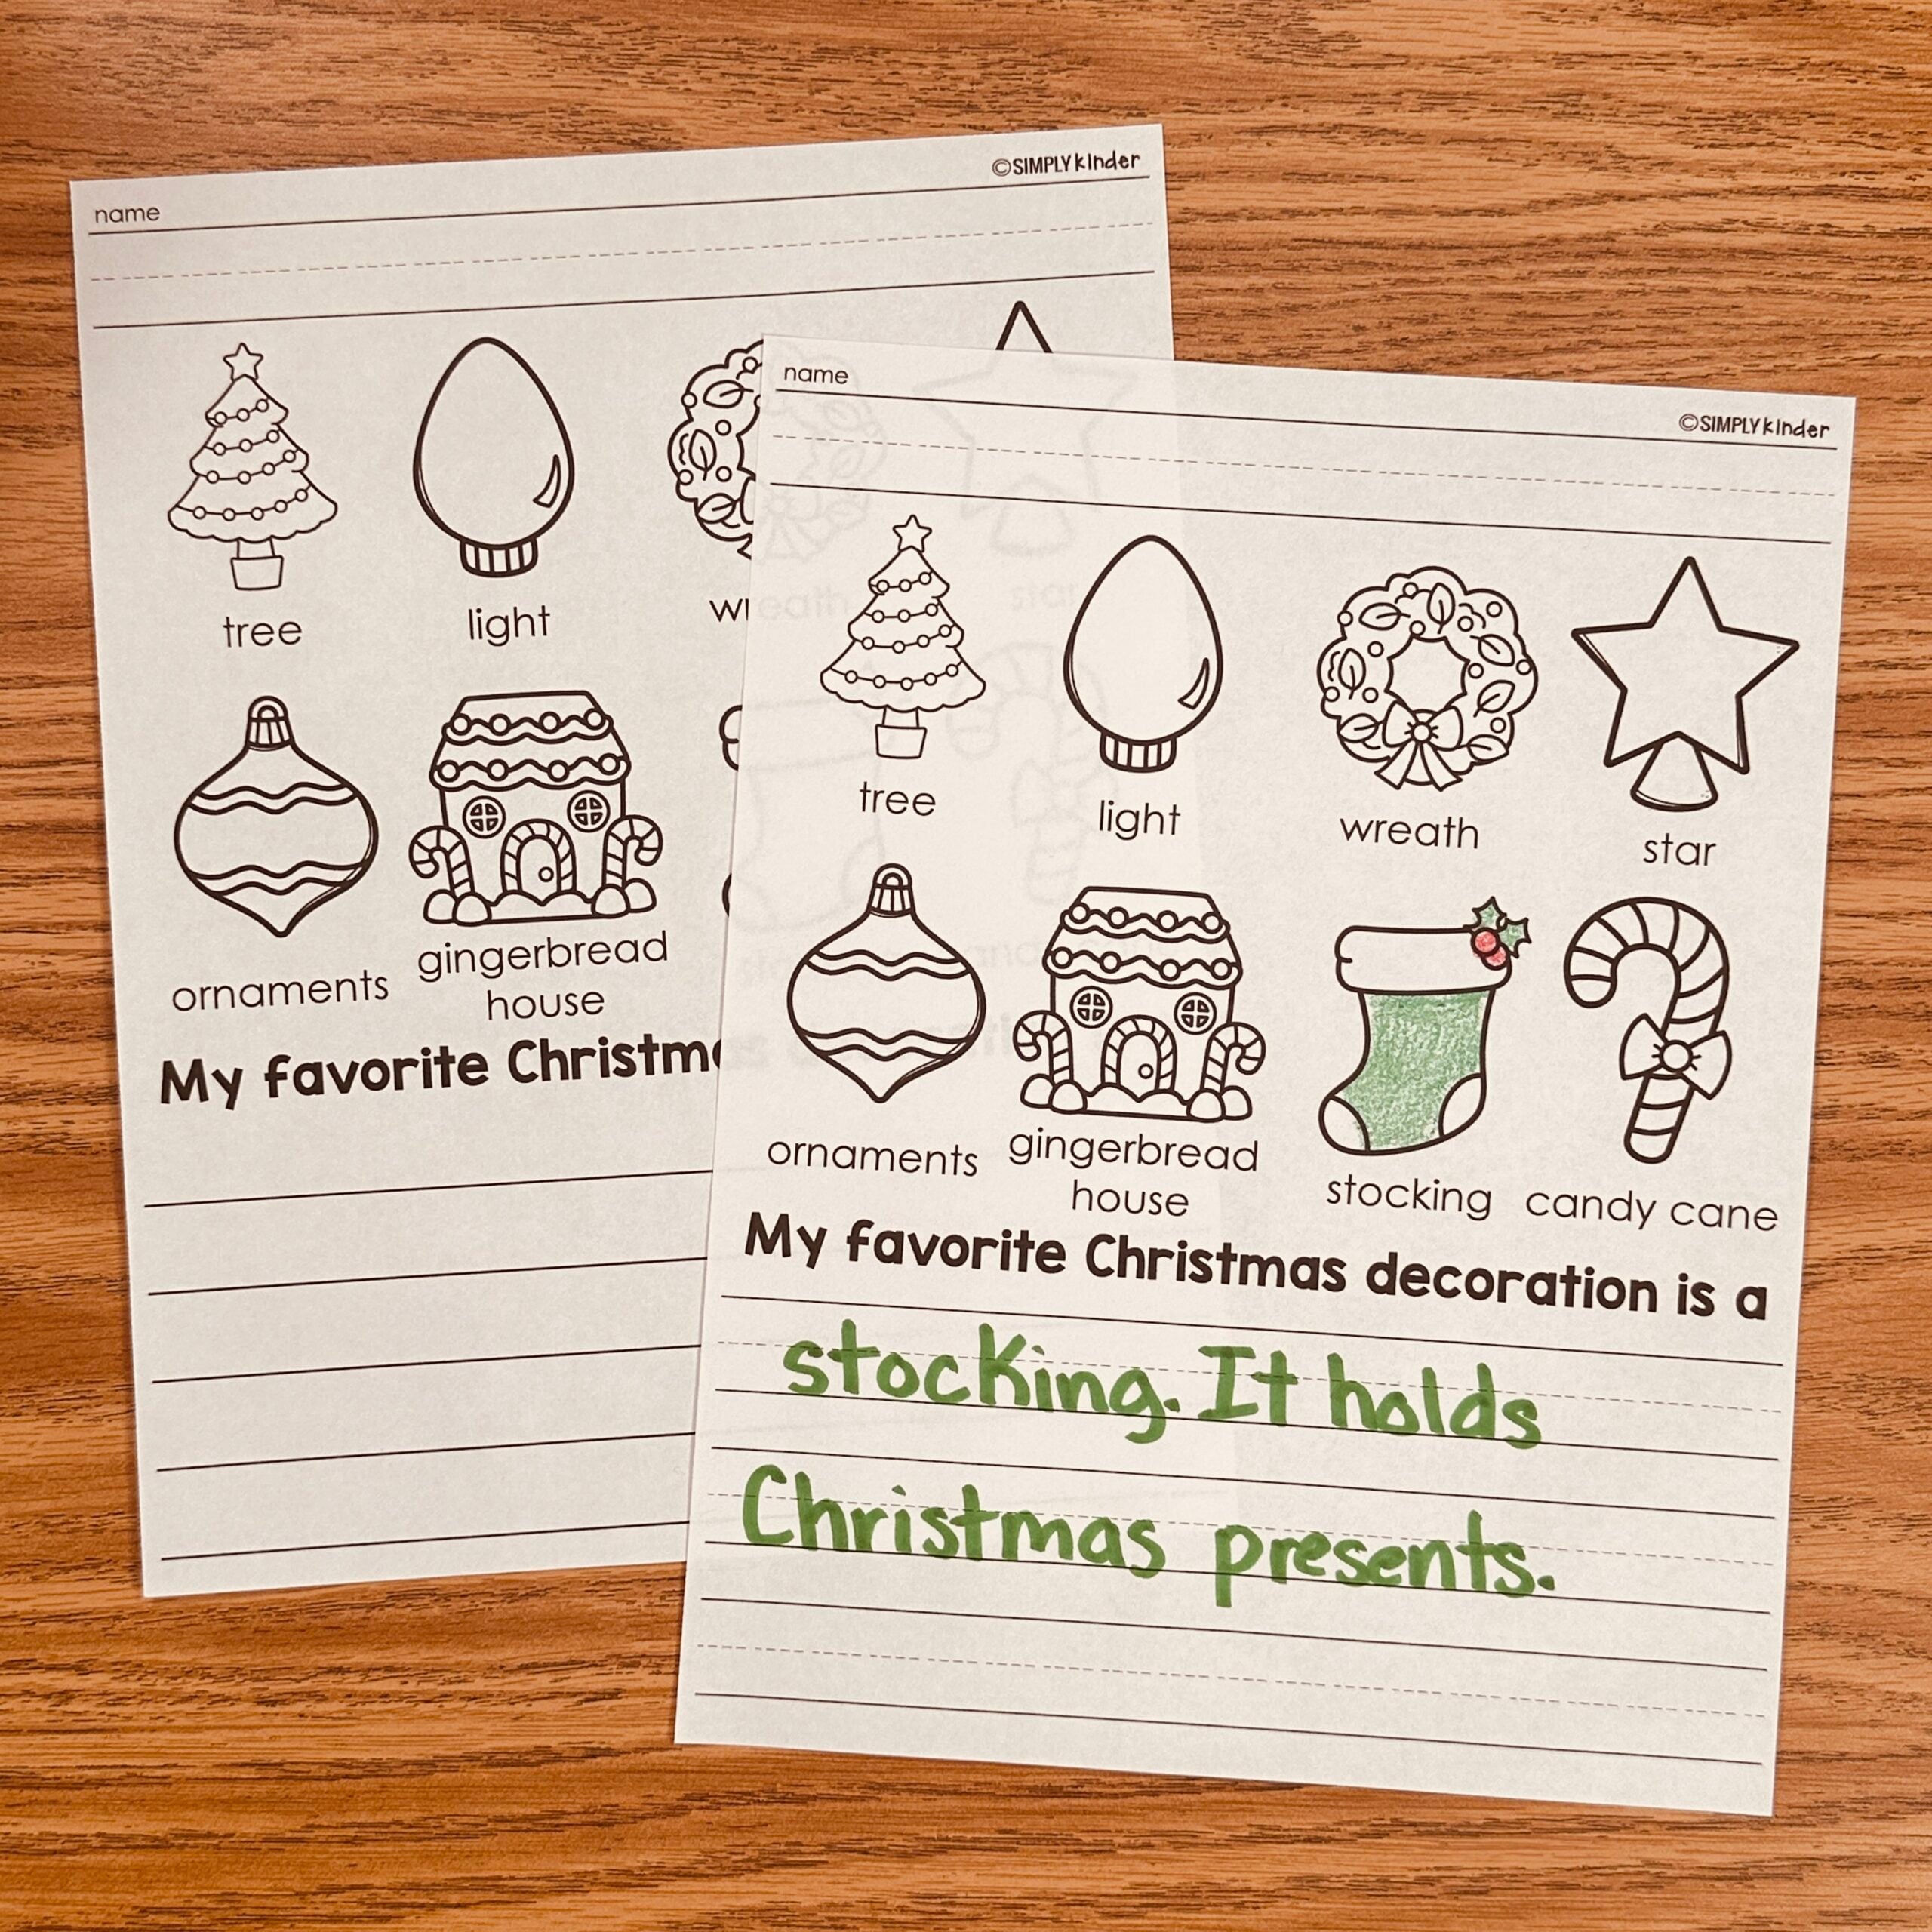
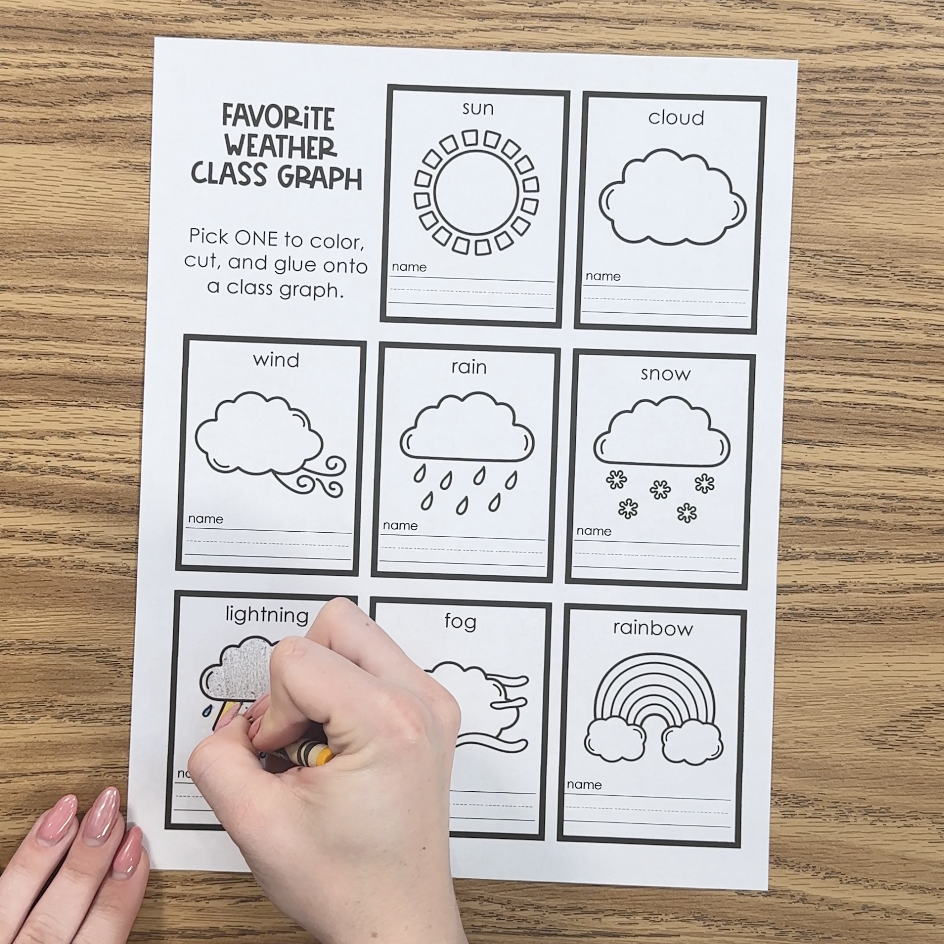
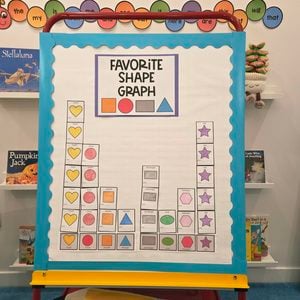
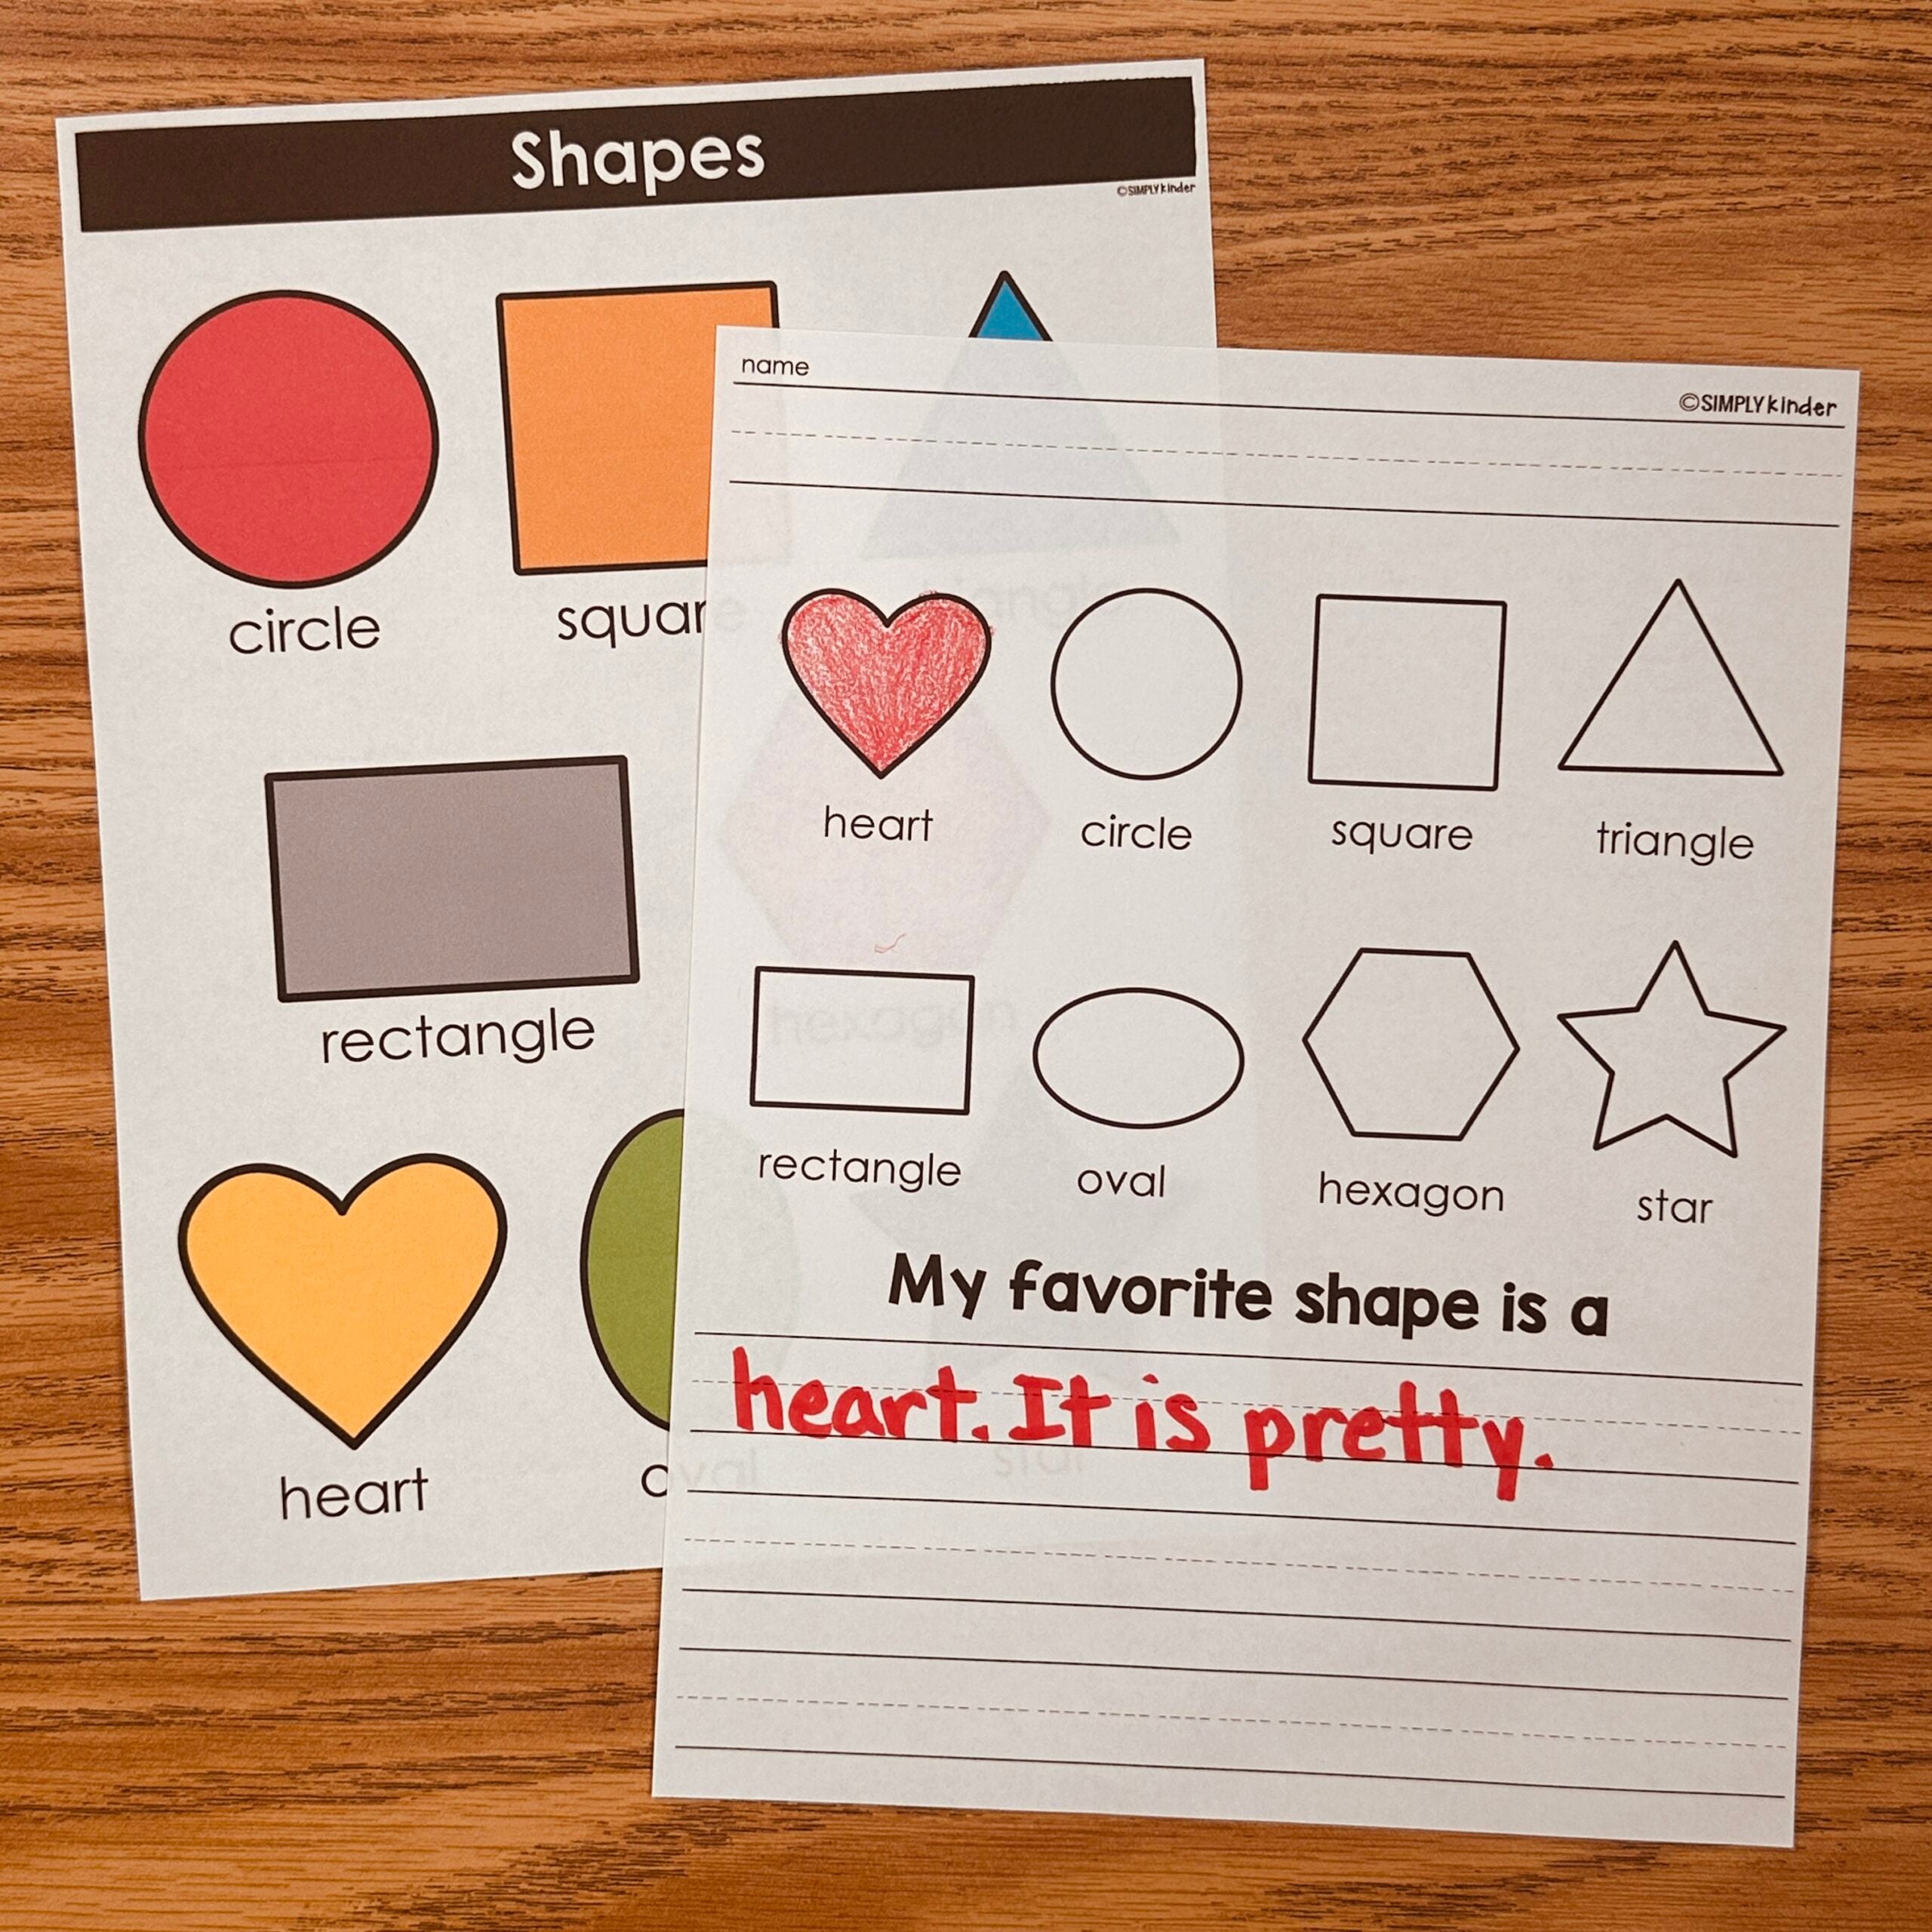
Start with the question and have students choose their favorite zoo animal. Add each student’s choice to the class graph, tally the results, create individual graphs, and then talk and write about what the data shows.
Students practice collecting, organizing, representing, and comparing real classroom data while learning important graphing vocabulary and concepts.
Click here to see all of our Class Graph Activities
Unlock this resource with Unlimited
Get this activity and thousands more ready-to-use resources for your classroom.
- Unlimited resource downloads
- Printables for preschool, kindergarten & first grade
- Less planning. More teaching.
Choose your plan and start downloading.
Already have an account? Log in here.